Line Counter
User Manual for End Users and System Administrators

Line Counter (LC) is a dedicated tool developed by Metrici for detecting and counting different objects in a video stream as they pass through a virtual gate.
Metrici LC is designed to help address and manage challenges in security, trespassing prevention, traffic monitoring, parking management, and retail analytics.
Dashboard
So, for example, if Metrici is set to detect people, every time a person passes through, an event is saved in the database with a photo as evidence and other relevant data.
Dashboard Overview
In the Dashboard menu, you can see all the details of one or more locations, if you manage more than one. From the dropdown menu at the top of the page, choose a location — or all locations — for which you want to see an instant report of the activity. Click the OK button after making your selection to display the corresponding information — see Fig.49 Dashboard.
On the left side, you will notice a list of all the lines created in the location you manage, along with the total capacity and counter (number of objects currently in the zone). The number of objects refers only to the selection you made previously. For example, if you selected to see reports about people, you will see the total number of people detected by Metrici on the cameras.
The dashboard is particularly useful for locations that have a finite number of objects that can fit in them, such as parking lots, marinas, and stores. It is not as suitable for other types of applications — for example, counting boxes shipped by a transportation company or cars crossing an intersection — where the Reports menu would be more useful.
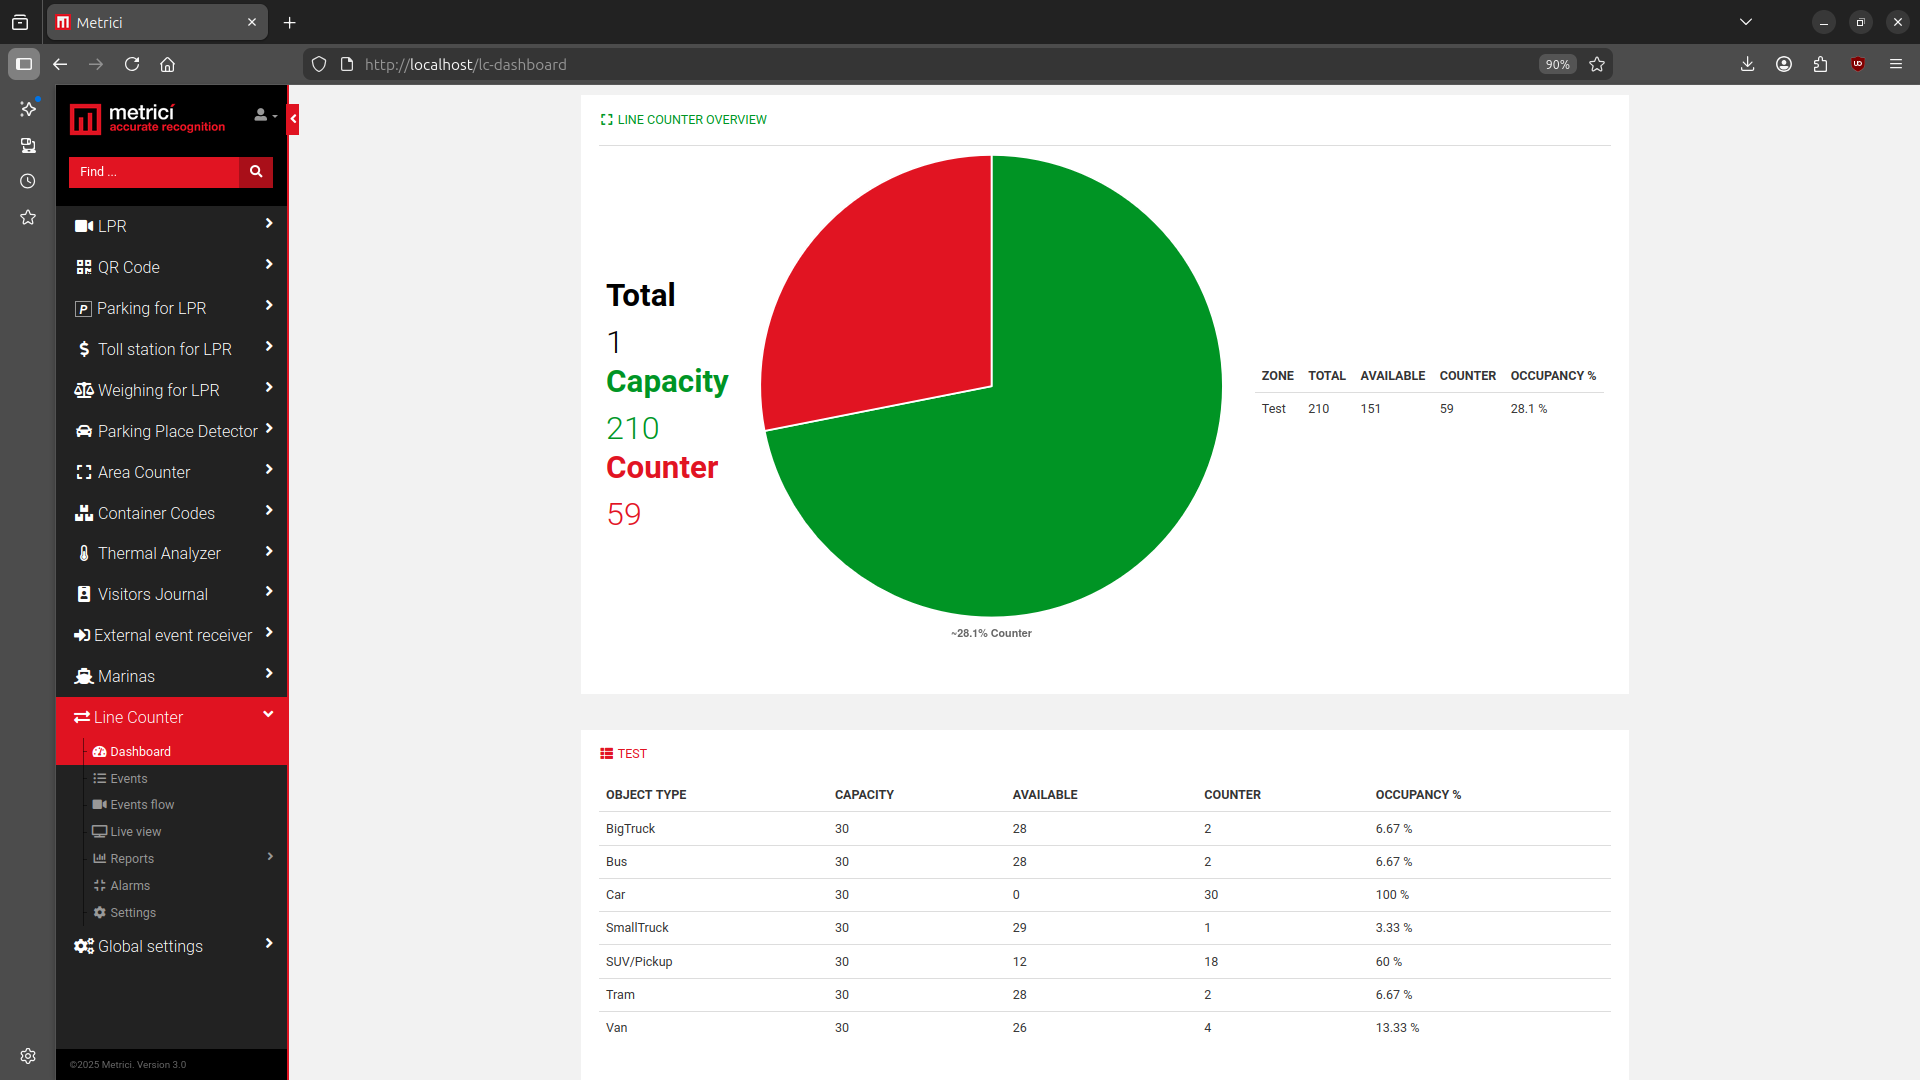
Dashboard Table Fields
| Field | Description |
|---|---|
| Object Type | The type of object being detected, as set in the Control Panel. |
| Capacity | The maximum number of objects that can fit in the zone. |
| Available | How many places are still available. |
| Counter | How many objects are in that zone at the current moment. |
| Occupancy | The percentage indicating how busy that zone is. |
Events
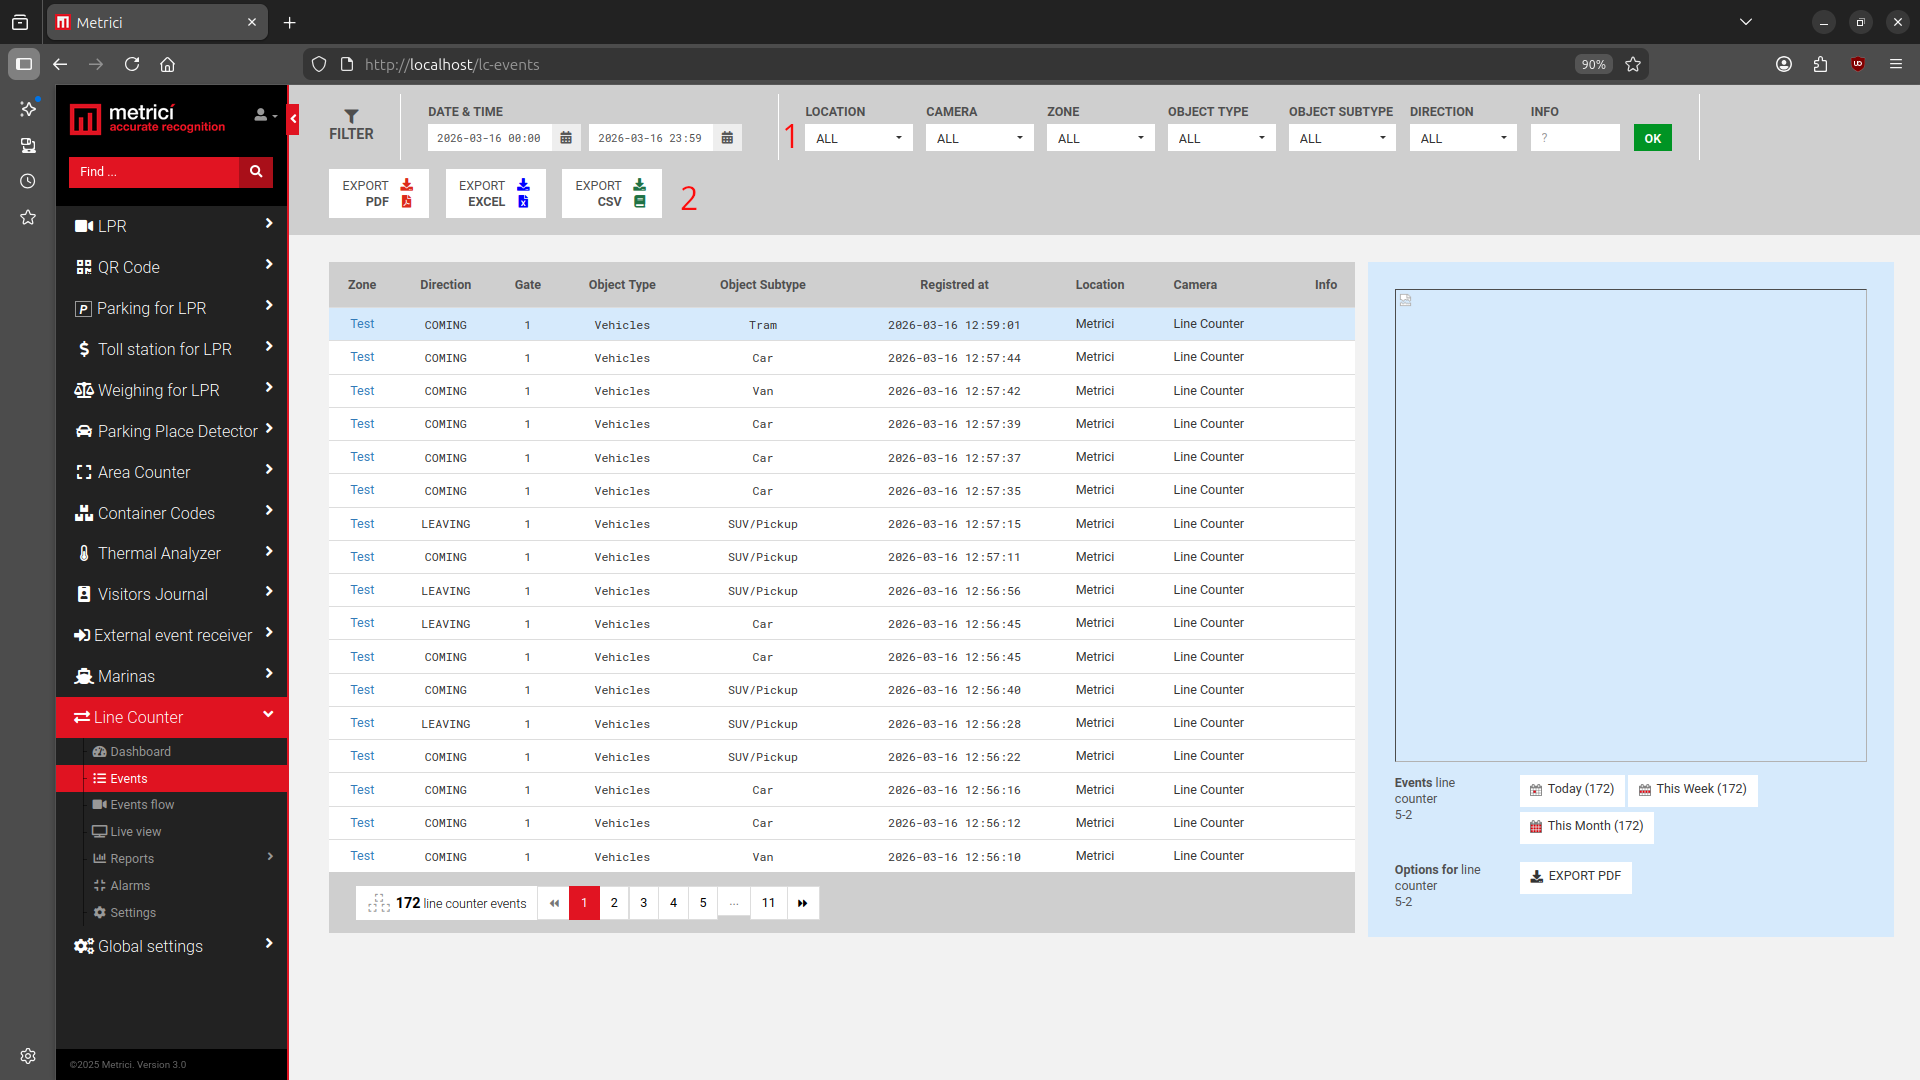
A list of all the changes that occurred for any camera in a location will be displayed in this menu. Several filters can be applied from the dedicated bar at the top of the page — see Fig.50 Events (1).
These filters refer to a time interval, the location or locations you want to see information about, the camera you want to monitor, as well as the object types.
Exporting Results
Any result, or the results of a filtered search, can be exported as a PDF, XLS, or CSV file — see Fig.50 Events (2).
A PDF file will contain a list of the selected search results with all the data about where, when, and how the status number changed, along with a still image from the moment the event occurred. If a companion camera is attached, the photo from that camera will be saved as well. An XLS file will include a list of data events without the photo captures.
Event Details
Each event includes the following information in the list: the direction of movement (coming or leaving), which gate was passed, its type and subtype (for example, the type may be "vehicle," but the subtype can be "bus" or "van," etc.), the date and time of the change, the location in which the event occurred, and the camera where the change took place.
On the right side of the screen, where the photo evidence is displayed, there is additional information about that particular gate. "Counter 5-2" represents camera 5 and gate 2 for that camera.
You can view every event change for a particular zone for today, this week, or this month. You can also add an alarm or export the data as a PDF.
The buttons are interactive and can be clicked — the list on the left will update according to the filter selected.
Events Flow
In this menu, you can see events as they occur, for a single location or all locations at once. Each time a virtual gate is passed, the event is immediately displayed here. A zone is a grouping of cameras that have been assigned together under the same category.
Live View
This page displays a live feed from your cameras at 1 frame per second. You can add or remove any camera from the live view, as long as it has been added in Global Settings → Locations & Cameras with the Line Counter type selected, and your user account has been granted viewing rights for that camera.
To add more cameras, choose the one you want from the dropdown menu and click the ADD LIVE VIEW button in the upper left.
On a live view image, click on the monitor icon to maximise the view (full screen) or on the X to close it. When you minimise an image that was made full screen, you will return to the view of all cameras set in live view.
By default, the live view field is automatically filled in by Metrici in the Control Panel with a URL such as http://localhost/io/lc/live_view.php. If the video is to be sent and viewed at a different address, replace localhost with the appropriate address or IP — for example, http://metrici.ro/io/lc/live_view.php.
Reports
In the Reports section, you can choose from three different report types. When you click on one of them, the usual filters are displayed: a date range, the location for which a report will be generated, the camera or cameras, zone, object type and subtype, and direction.
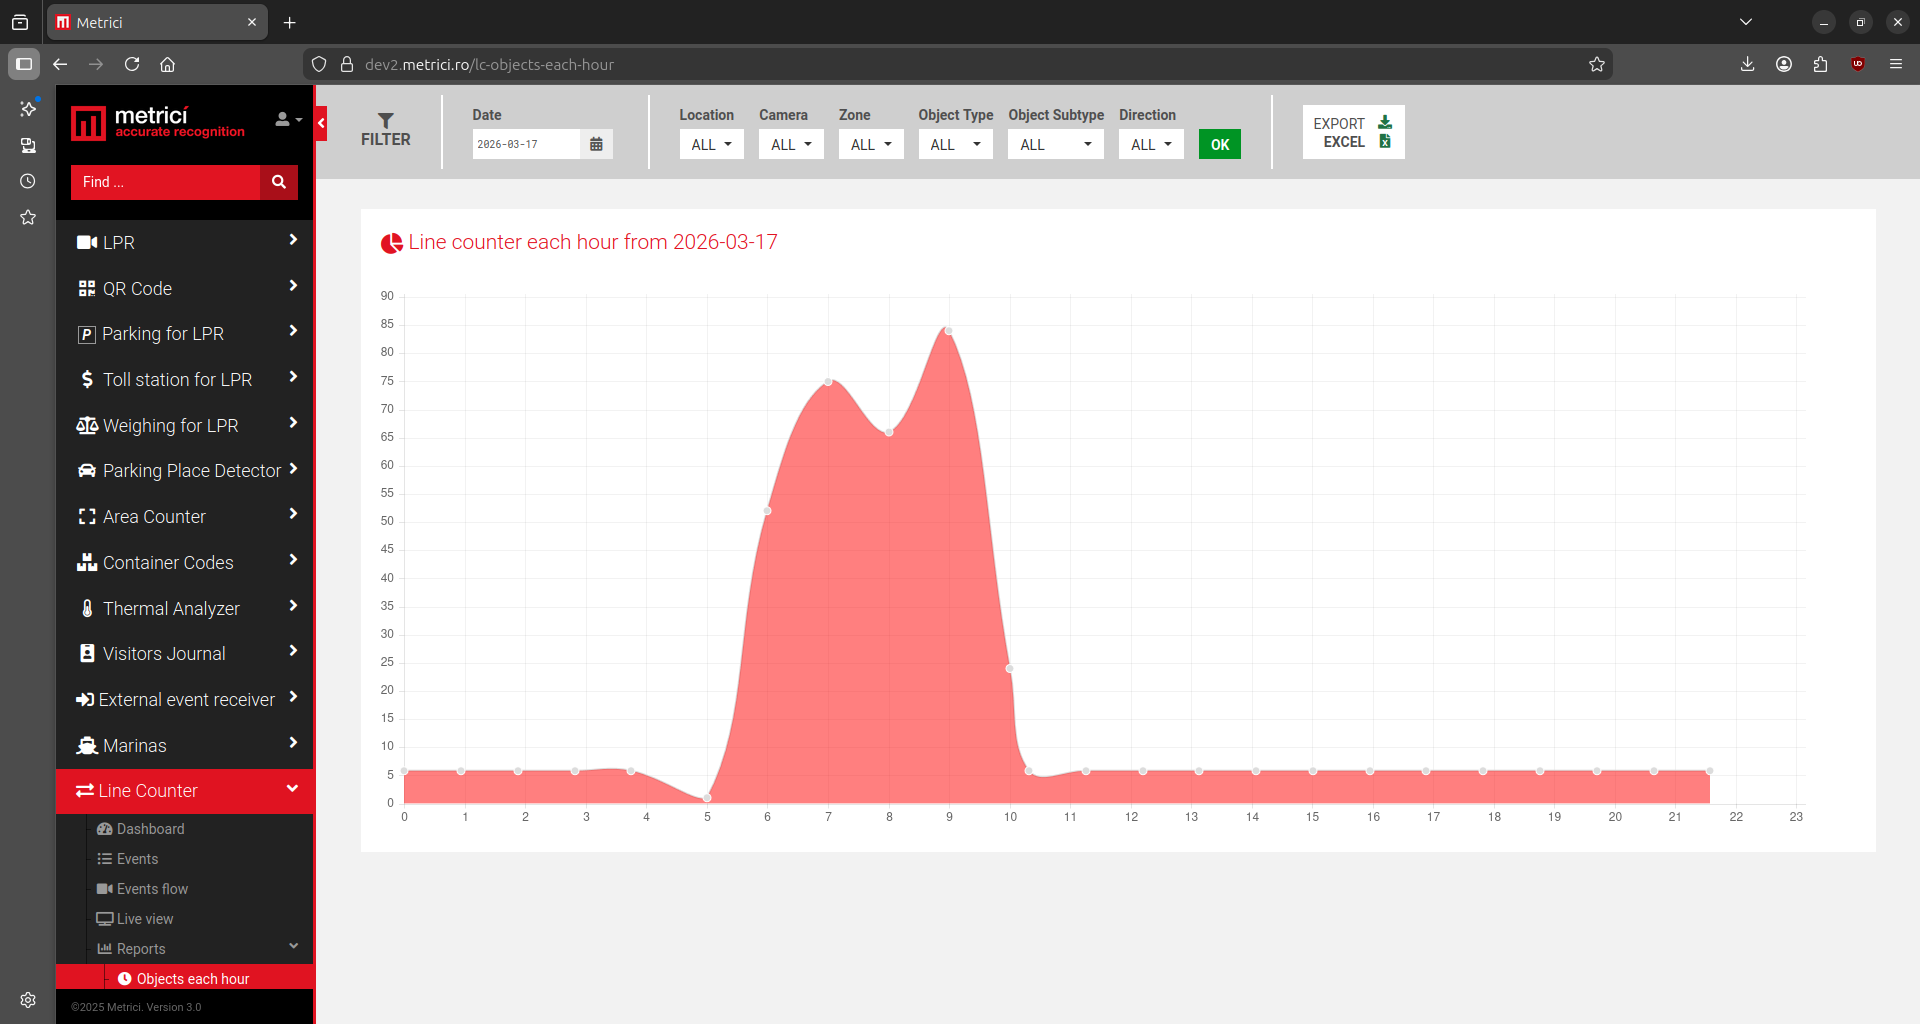
Objects Each Hour
This report generates a chart with the number of objects for each hour within the selected time interval.
Objects Each Day
This report generates a chart with the number of objects for the current week by default, or for another time interval set in the filter.
Objects Each Month
This report generates a chart with the number of objects for the selected input data.
Alarms
Each location or zone can have its own alarms that trigger when one or more conditions are met.
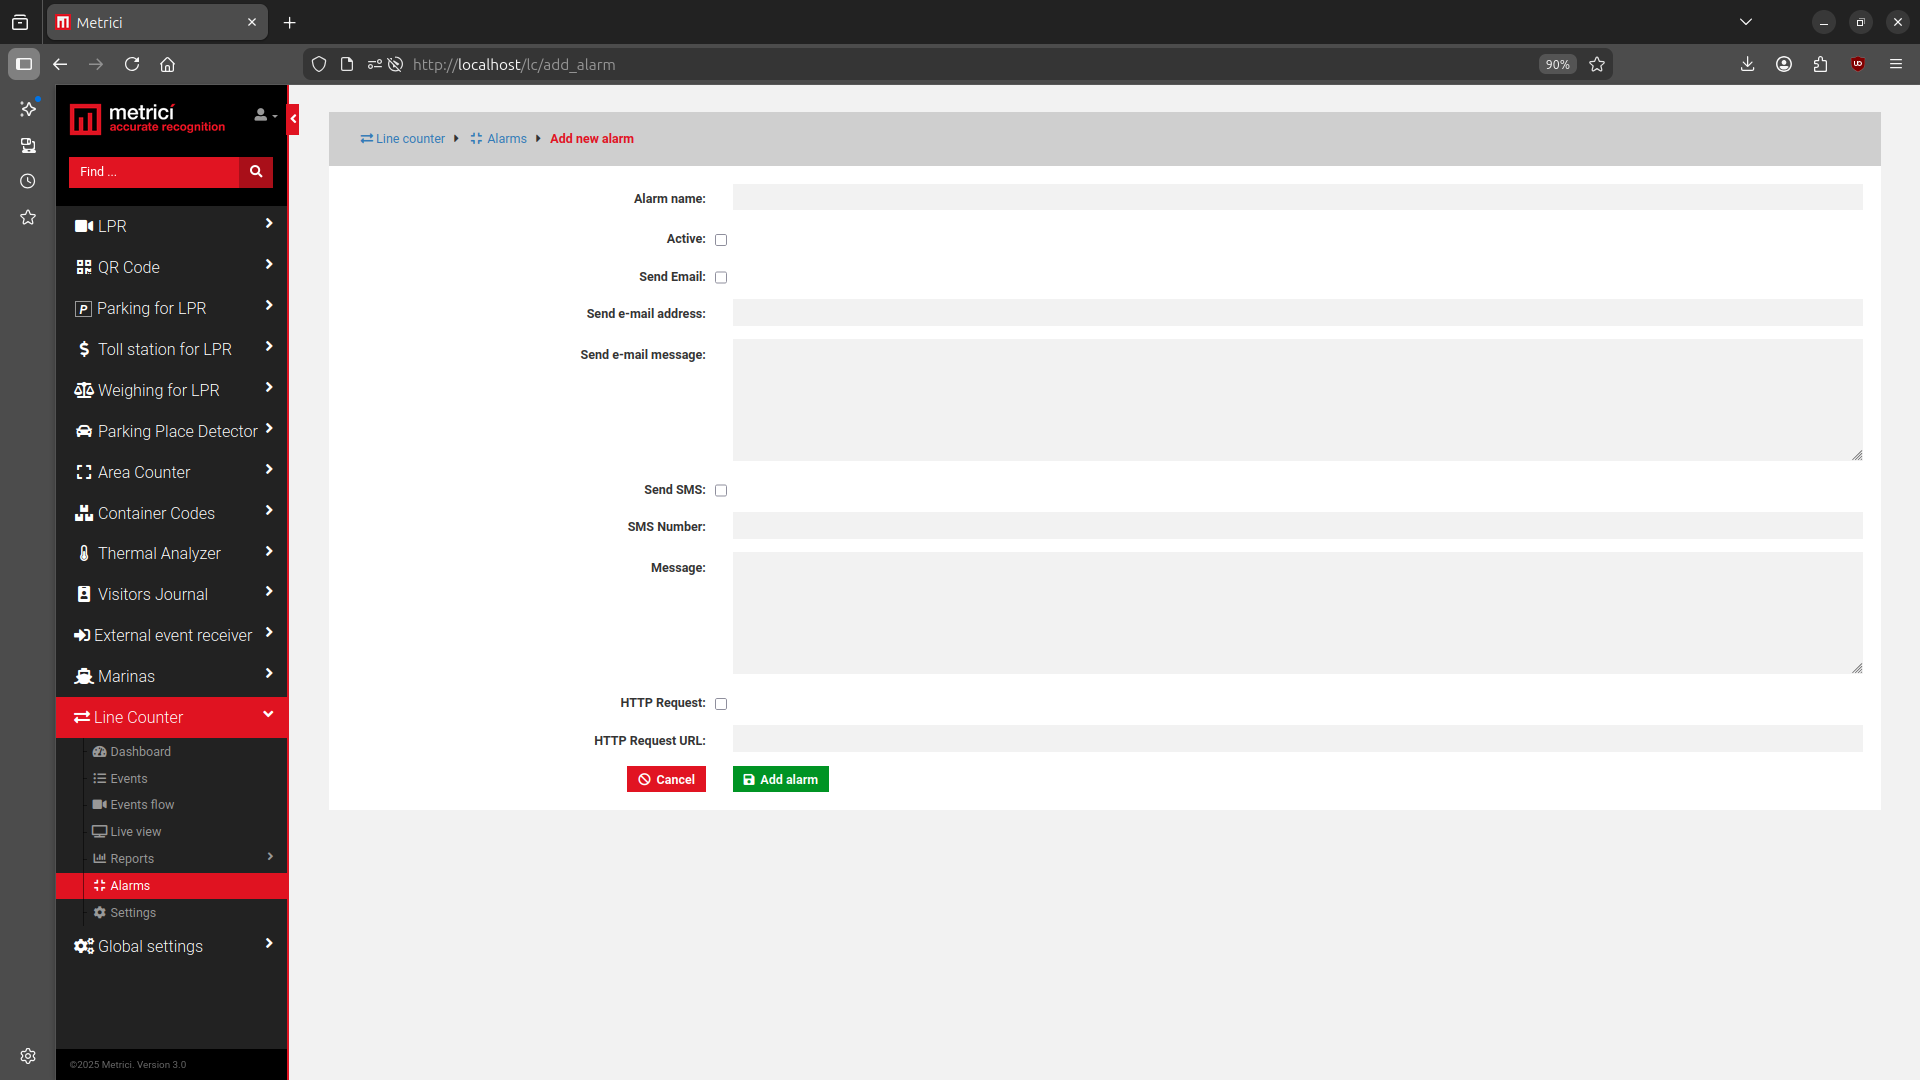
To add an alarm, click on the green ADD ALARM button in the upper right of this menu.
Alarm Types
An alarm can be set to active or inactive, and you can choose one or all of the three notification types: an email alert, an SMS message to a phone number (if a GSM module is attached to the server), or an HTTP request.
Email: Fill in the email address field with the address to which the notification will be sent. You can also personalise the message that will be delivered.
SMS: Click on the Send SMS box, enter the phone number to which the message will be sent, and write the message that will be delivered. Multiple phone numbers can receive SMS alerts, but each number must have its own alarm set up. Multiple phone numbers cannot be set in a single alarm.
HTTP Request: This type of alarm triggers a URL when activated, allowing it to control external hardware such as a barrier, a traffic light, an audio signal, etc.
Setting Conditions
After an alarm has been created (with a name) and a type has been selected (SMS, email, or HTTP), you need to define the conditions under which the alarm will activate.
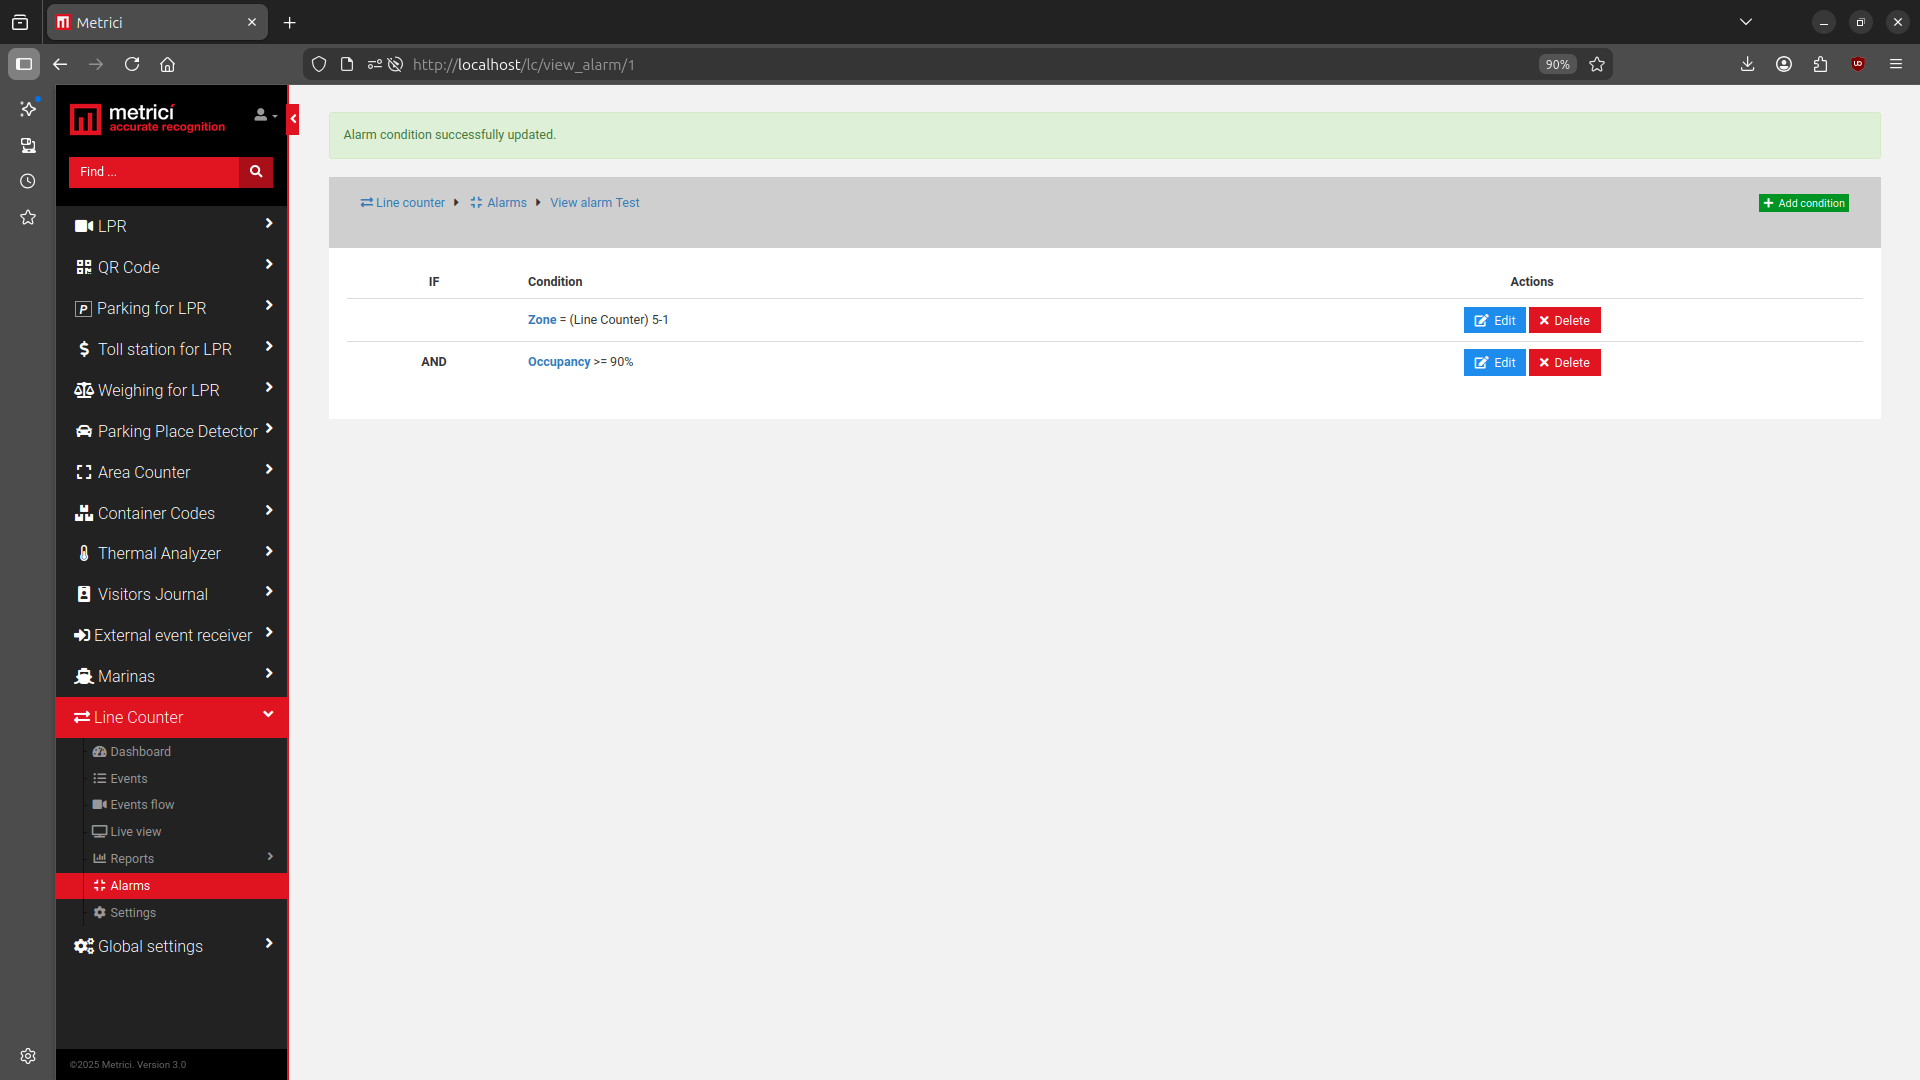
Click the green Conditions button to add new conditions for that alarm. You can add as many conditions as you need and save them.
The first condition when setting up an alarm is to establish an alarm item — this can be a zone for any location. Based on the selected item, you will then add further conditions.
Comparison Operators
| Operator | Meaning |
|---|---|
| = | The condition belongs to or is equal to a specific value. |
| != | The condition is different from or not included in the alarm item. |
| < | Smaller than — usually used for alarms with time units. |
| <= | Smaller than or equal to — also used for alarms with time units or percentages. |
| > | Greater than — usually used for alarms set with timestamps. |
| >= | Greater than or equal to — usually used with time units. |
Finally, for an alarm to be saved, you must select a parameter to apply it to.
Settings
In this section, you can set how many days to keep your events recorded in the database. You can also see how many events are currently registered and how much disk space they are using.
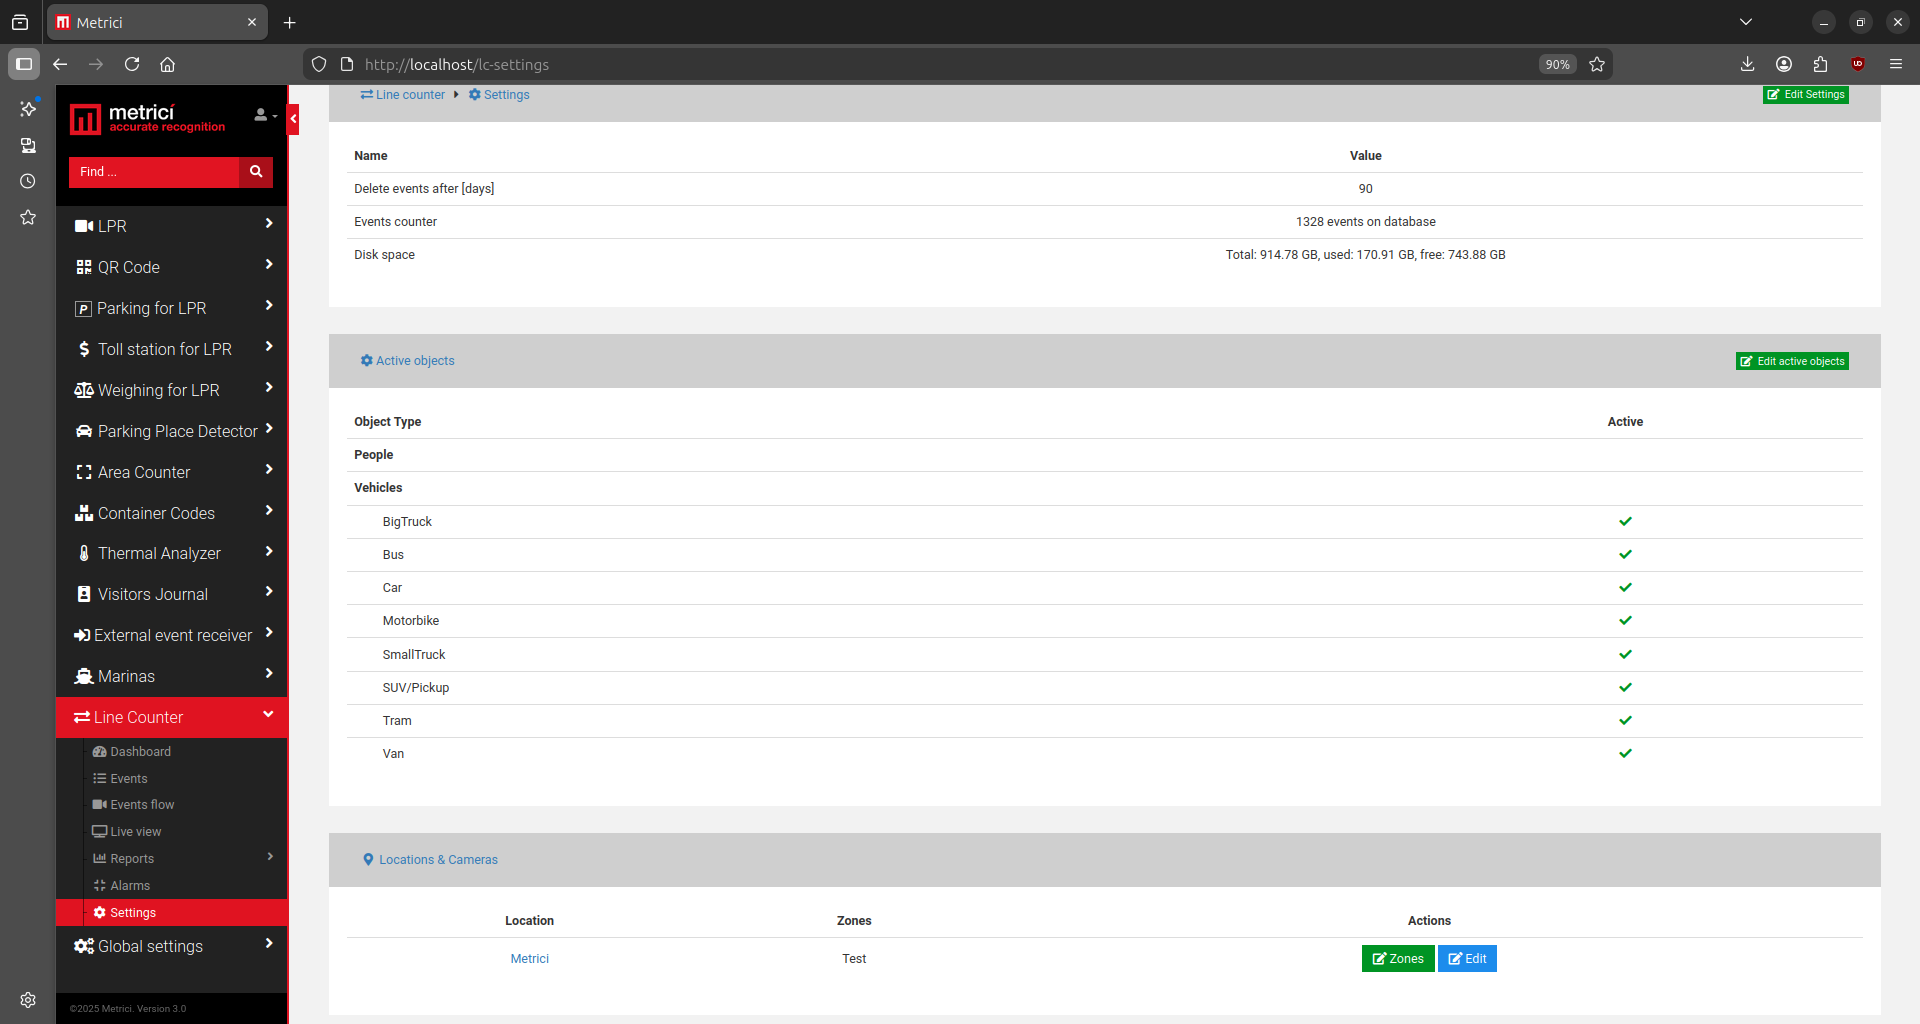
Locations and Cameras
Only locations introduced in Global Settings will appear in this menu. For a location to be displayed in the Line Counter menu, it must have at least one camera assigned to it.
At the bottom of the page, you can see all locations created in the Global Settings menu. Click on the name of a location to open it. In the new menu, you can create zones for each location. For example, a location can be an entire mall — then one zone could be the first floor, another could be the underground level, another an entrance, and so on.
Each zone will have its own designated cameras. Start by creating a zone, even if you only need one, and choose a name for it. From the Object Type dropdown menu, choose what kind of object will be counted: people, vehicles, boats, etc.
After a zone is created, click the blue View button. On the new page, choose which cameras or counting gates from the list are associated with that zone, then press Save when finished.
Also remember that if you ever delete a counting gate from a detection engine, you should also unregister it from this list in the Interface.
Edit Zone – Capacity and Counter
The green EDIT ZONE button lets you set the communication parameters with the Metrici LED Display (if one is connected) and also configure capacity parameters for that particular zone.
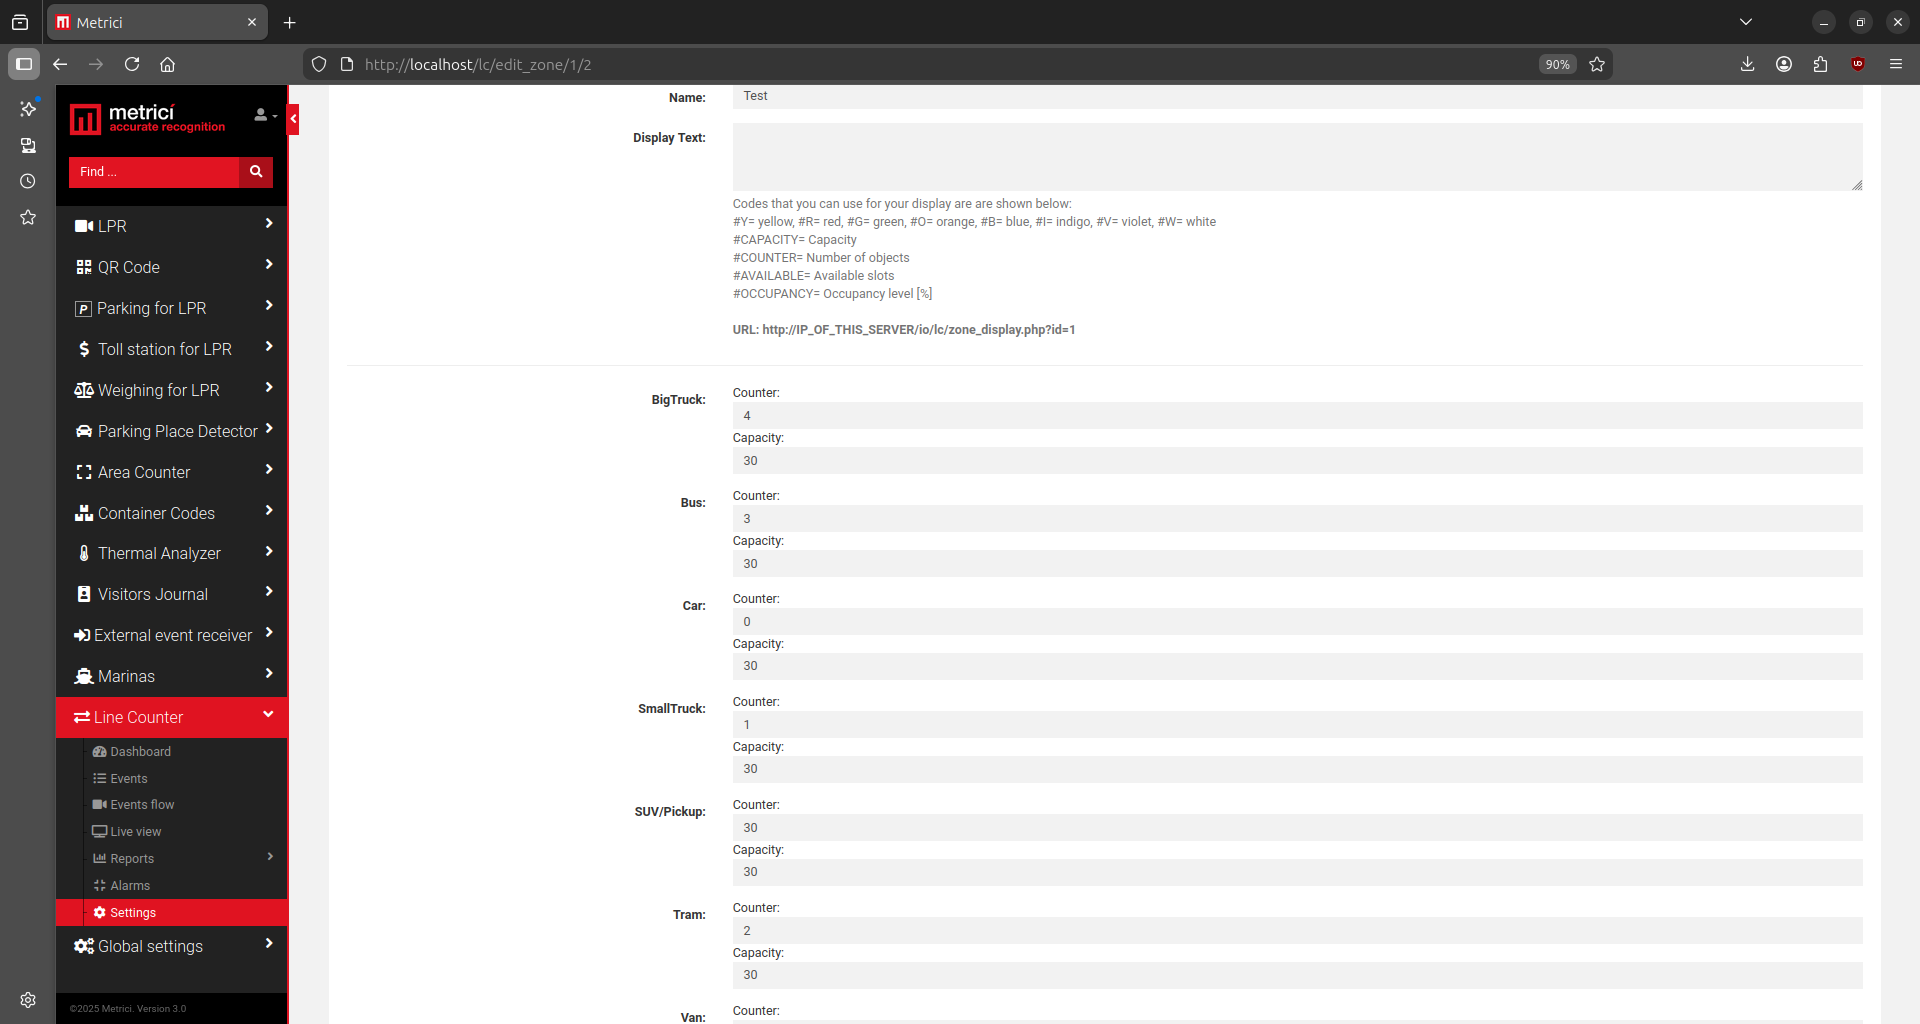
Counter is the number of objects inside the zone at any given time. It is calculated as the difference between entries and exits. When creating a zone — or at any time after that — you can manually change the number of objects inside.
Capacity is the total number of objects that can fit in a zone. Once you set it, you will be able to see the occupancy percentage and set alarms when capacity is approaching 100%.
These parameters are useful in applications where a maximum capacity applies to a zone or location, such as a parking lot, a store, or a marina. They are not useful in other applications — such as counting vehicles on a street or objects on a production line — and should be left at 0 for capacity in those cases.
Communication with Display
If you want to display information about your zones on a Metrici LED Display, you can configure it here.
| Colour Code | Colour |
|---|---|
#Y | Yellow |
#R | Red |
#G | Green |
#O | Orange |
#B | Blue |
#I | Indigo |
#V | Violet |
#W | White |
| Data Code | Displays |
|---|---|
#CAPACITY | Total capacity |
#COUNTER | Number of objects |
#AVAILABLE | Available slots |
#OCCUPANCY | Occupancy level [%] |
The first letter after the hashtag represents the colour in which the information is shown. On your Metrici LED Display, enter a URL such as http://IP_OF_THIS_SERVER/io/lc/zone_display.php?id=5, which is automatically generated in the Metrici Interface.
The number after a data code indicates how many digits to use. For example, #CAPACITY3 will display the capacity using a maximum of 3 characters.
For a better understanding, see also the Metrici LED Display user and integration guides.