Area Counter
User Manual for End Users and System Administrators

Area Counter counts how many people/ vehicles / custom objects etc. are in a defined area in a precise moment in time.
The key thing to remember about Metrici Area Counter is that an event is saved in the database every time the number of objects defined by the user changes in the video stream, whether it is the full image or a specific zone.
For example, if Metrici is set to detect people in a zone covered by the camera, every time the number of people in the zone changes — from 0 to 1, from 5 to 4, from 10 to none, and so on — an event is saved in the database along with a photo witness and additional data.
Dashboard
The Dashboard menu displays all the details of one or more locations that you manage. From the dropdown menu at the top, select a specific location or all locations to view an instant activity report. Remember that you have to create a location and add cameras defined as "area counter camera" in General Setttings/Locations and Cameras menu to have access to the module interface and dashboard.
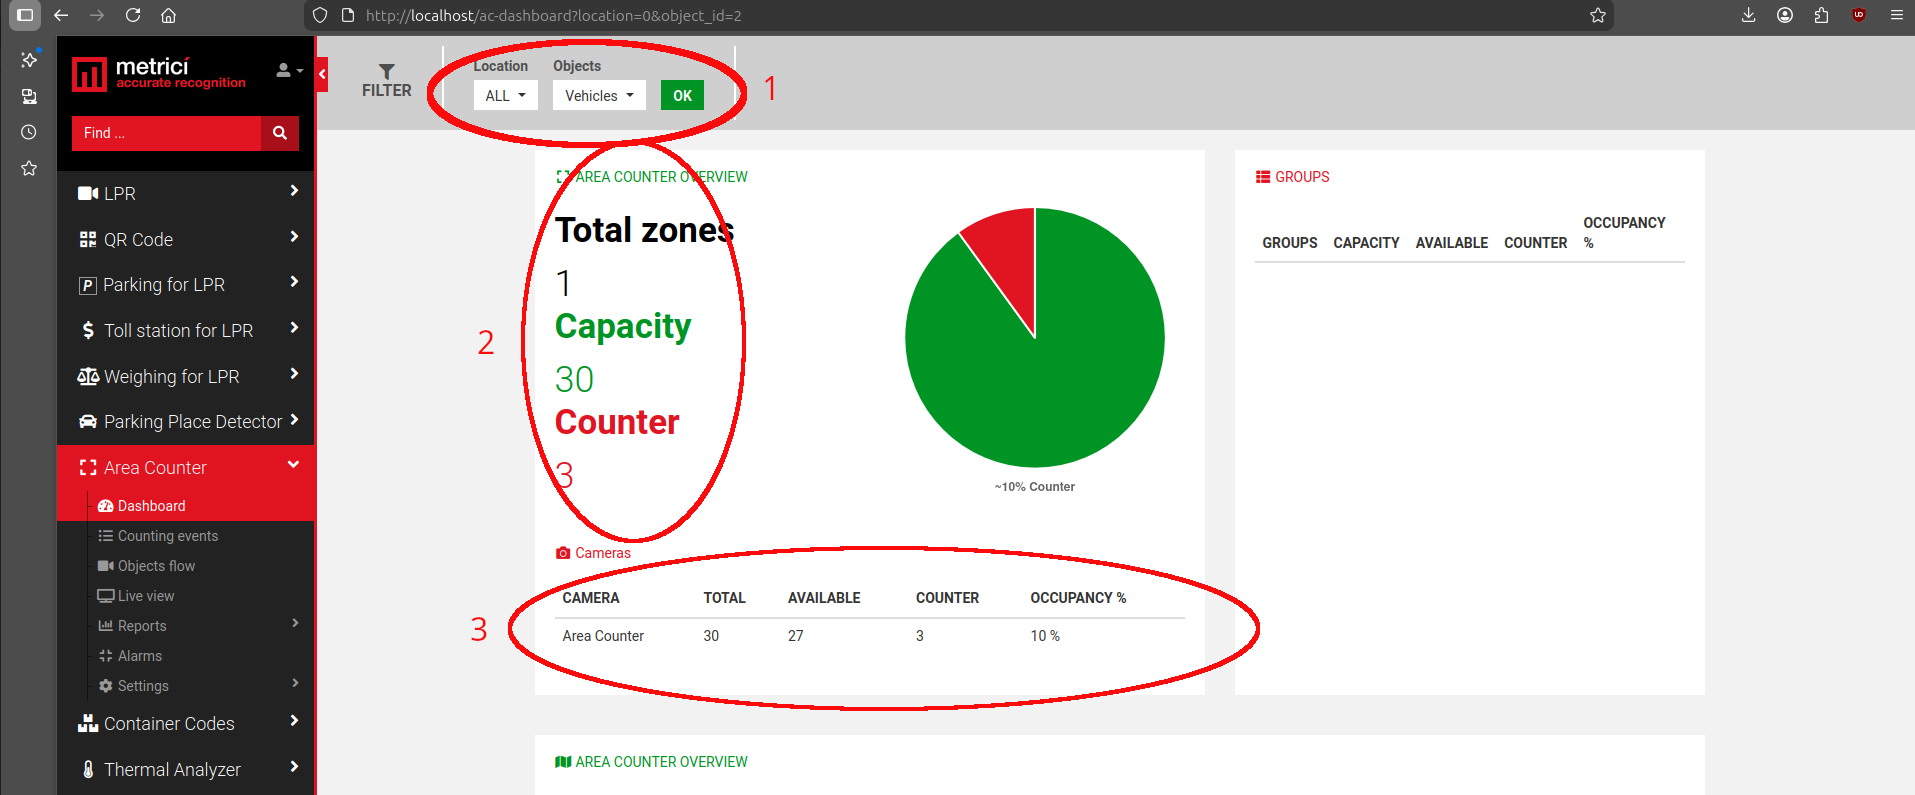
Next to it, a second dropdown menu allows you to choose the type of objects you want to see detection details for, such as people or vehicles, boats, custom etc.. Click the OK button after making your selection to display the corresponding information — see Fig.37 Dashboard (1).
On the left side of the page, you will see a list of all zones created in the selected location, along with the total capacity and the current counter (the number of objects present at that moment) — see Fig.37 Dashboard (2). The object count refers only to the type you selected previously — for example, if you chose to view reports about people, you will see the total number of people detected by Metrici across the cameras.
Below the zone list, a table is displayed with the following fields — see Fig.37 Dashboard (3):
| Field | Description |
|---|---|
| Camera | The name of the camera as configured in Global Settings. |
| Total | The maximum number of objects that can fit in the frame or zone for that camera. |
| Available | How many places are still available. |
| Counter | How many objects are currently in that zone. |
| Occupancy | The percentage indicating how busy that zone is. |
This is a split dashboard where the information is displayed separately for each camera in the locations you selected.
On the right side of the page, you will see a menu for the groups configured in your location.
Counting Events
This menu displays a list of all changes that have occurred across any zone and camera in a location. A filter bar at the top of the page allows you to refine the results by time interval, location, camera, group, and object type.
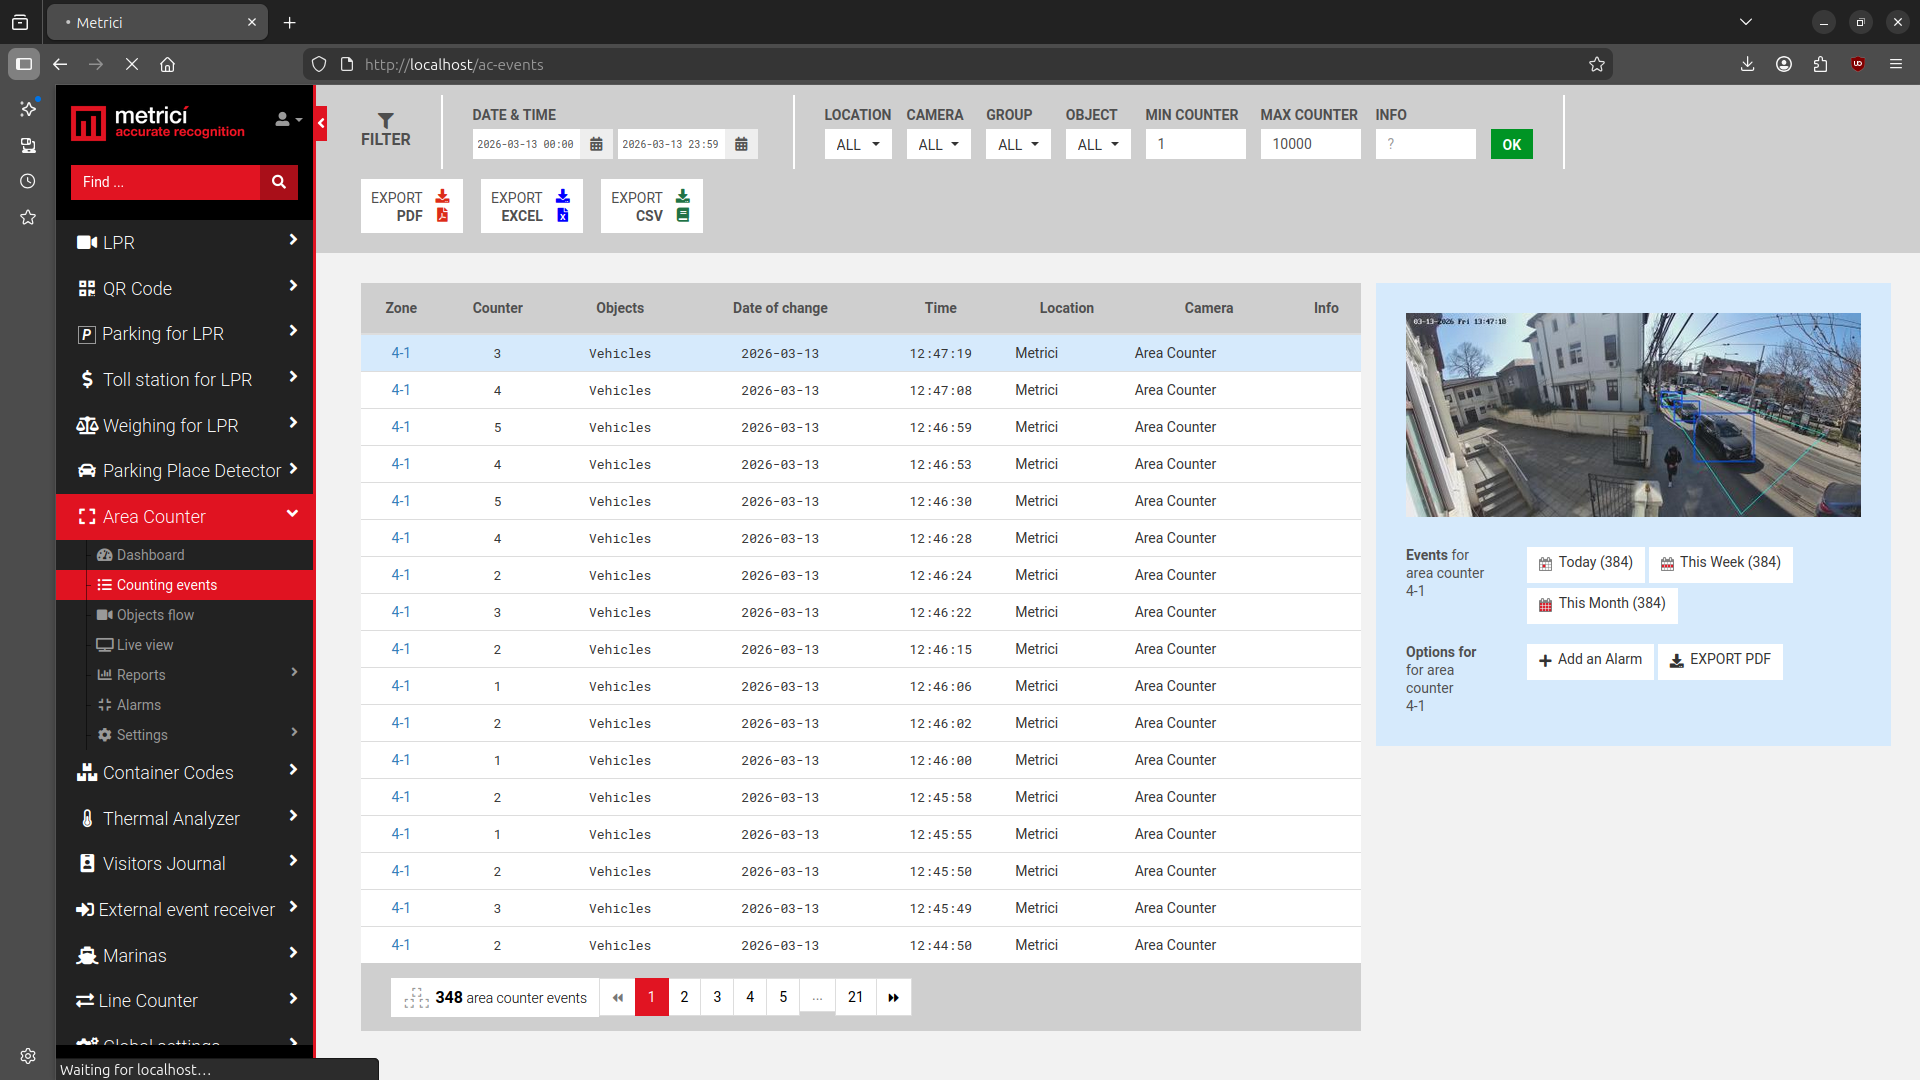
Any result or set of filtered results can be exported in three formats:
- PDF — contains the full list of matching events with all data about where, when, and how the object count changed, along with a still image captured at the moment the event occurred. If a companion camera is attached, its photo will be included as well.
- XLS — contains a list of event data without photo captures.
- CSV — raw data for further processing.
Each event in the list includes the following information: the counter (how many objects were in the zone after the change), the type of object Metrici is detecting, the date and time of the change, the location where the event occurred, and the camera that captured it.
On the right side of the screen, the photo witness is displayed along with additional details about the selected zone and event. For example, a counter label such as 4-1 represents camera 4 and zone 1 for that camera.
Several interactive buttons are available for the selected event:
- Today / This Week / This Month — click any of these to filter the list and view all event changes for that particular zone within the selected time period.
- Add Alarm — creates an alarm for that zone. Remember to add conditions to the alarm for it to function correctly.
- Export PDF — exports the selected event as a PDF document.
Object Flow
This feature allows users to generate alarms for specific events within the Metrici Interface. Users can select which locations and cameras to monitor. If you manage multiple locations and choose only one, the alerts will display detections exclusively from the selected location.
Live View
As the name suggests, this page allows you to watch your cameras in real time. You can add or remove cameras from this menu at any time, as long as they have been registered in Global Settings under Locations & Cameras, set as Area Counter cameras, and you have the necessary viewing rights.
To add a camera, select the one you want from the dropdown menu and click the Add Live View button in the upper left. Multiple cameras can be displayed simultaneously.
On any live view image, click the monitor icon to maximize the view to full screen, or click the X to close it. When you minimize a full-screen image, you will return to the multi-camera layout showing all cameras currently set in the live view.
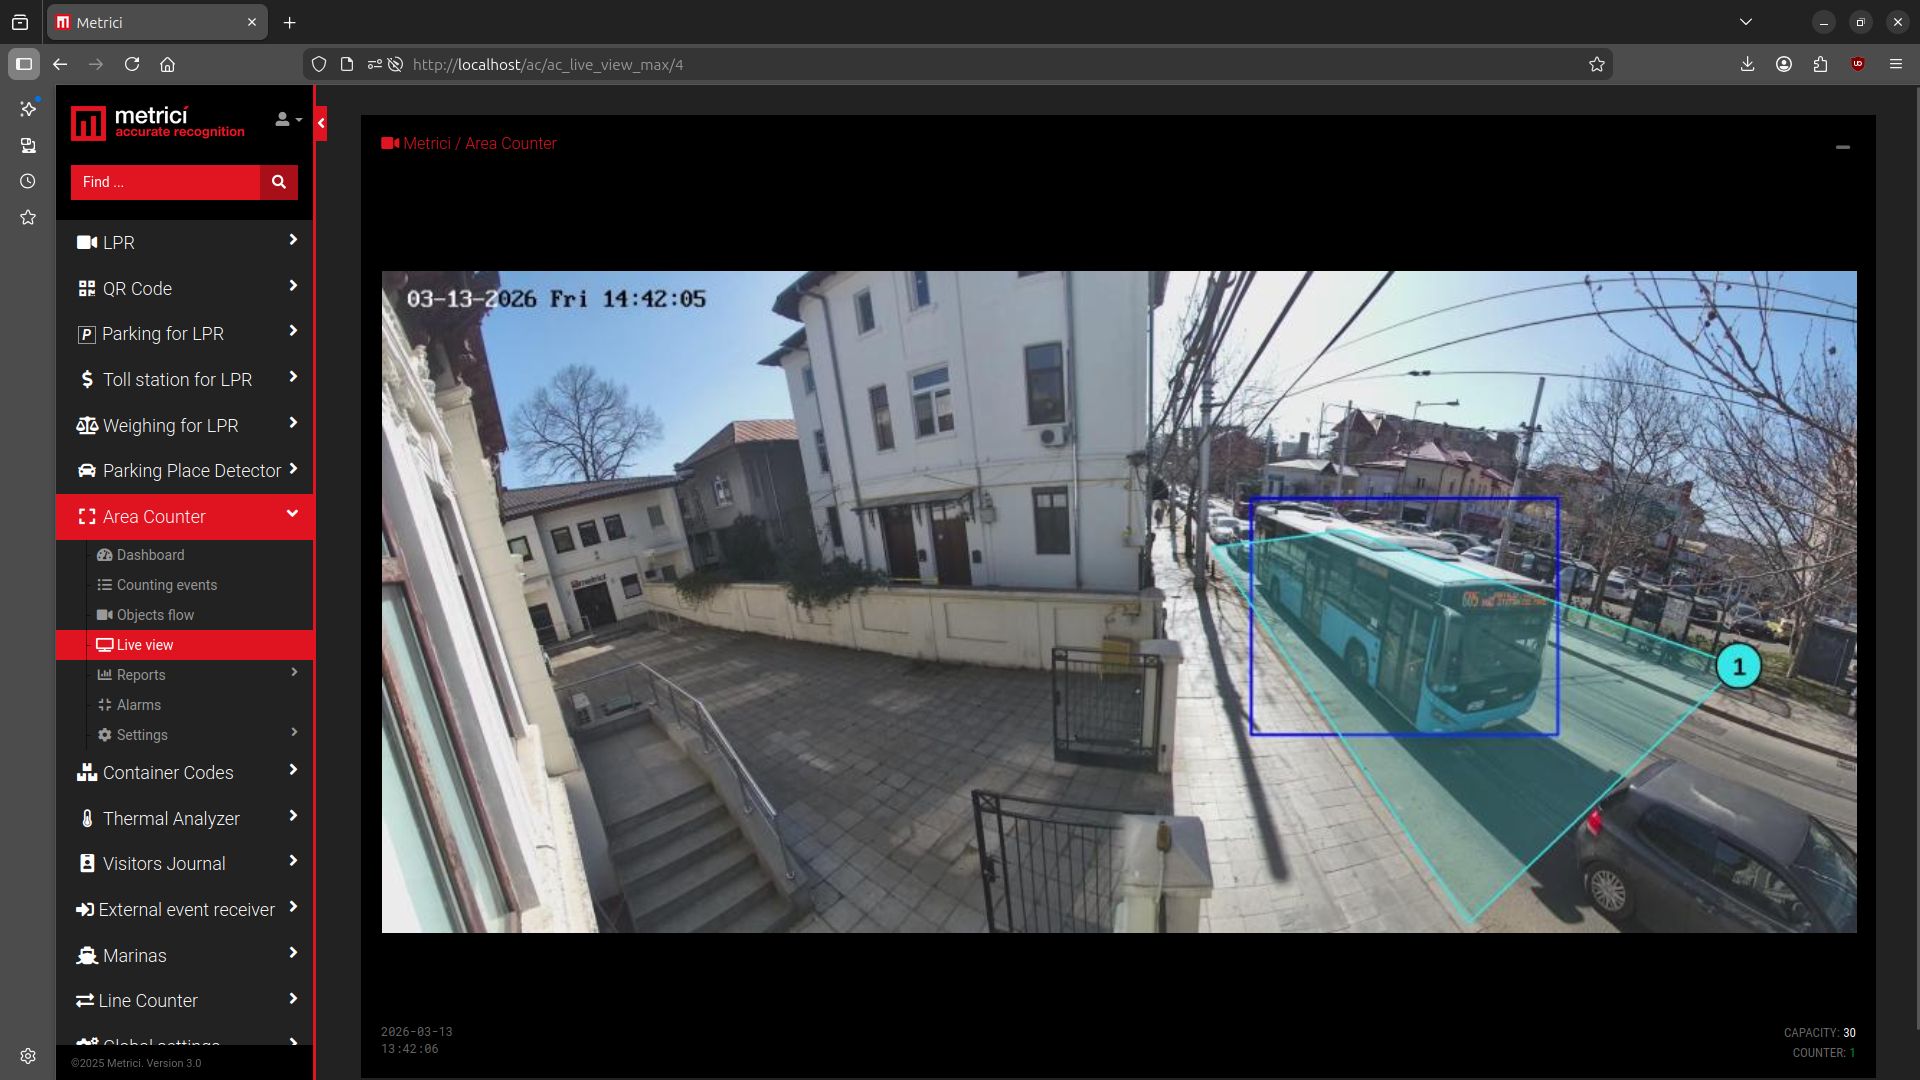
http://localhost/io/ac/live_view.php. If the video stream needs to be sent to or viewed from a different address, replace localhost with the appropriate address or IP — for example, http://metrici.ro/io/ac/live_view.php.Reports
In the Reports section, you can choose from multiple report types. When you select one, the standard filters are displayed: time interval, location, camera or cameras, object type, and group.
Occupancy reports show values as percentages, while Counter reports display absolute numbers for each selected period.
Occupancy Each Hour
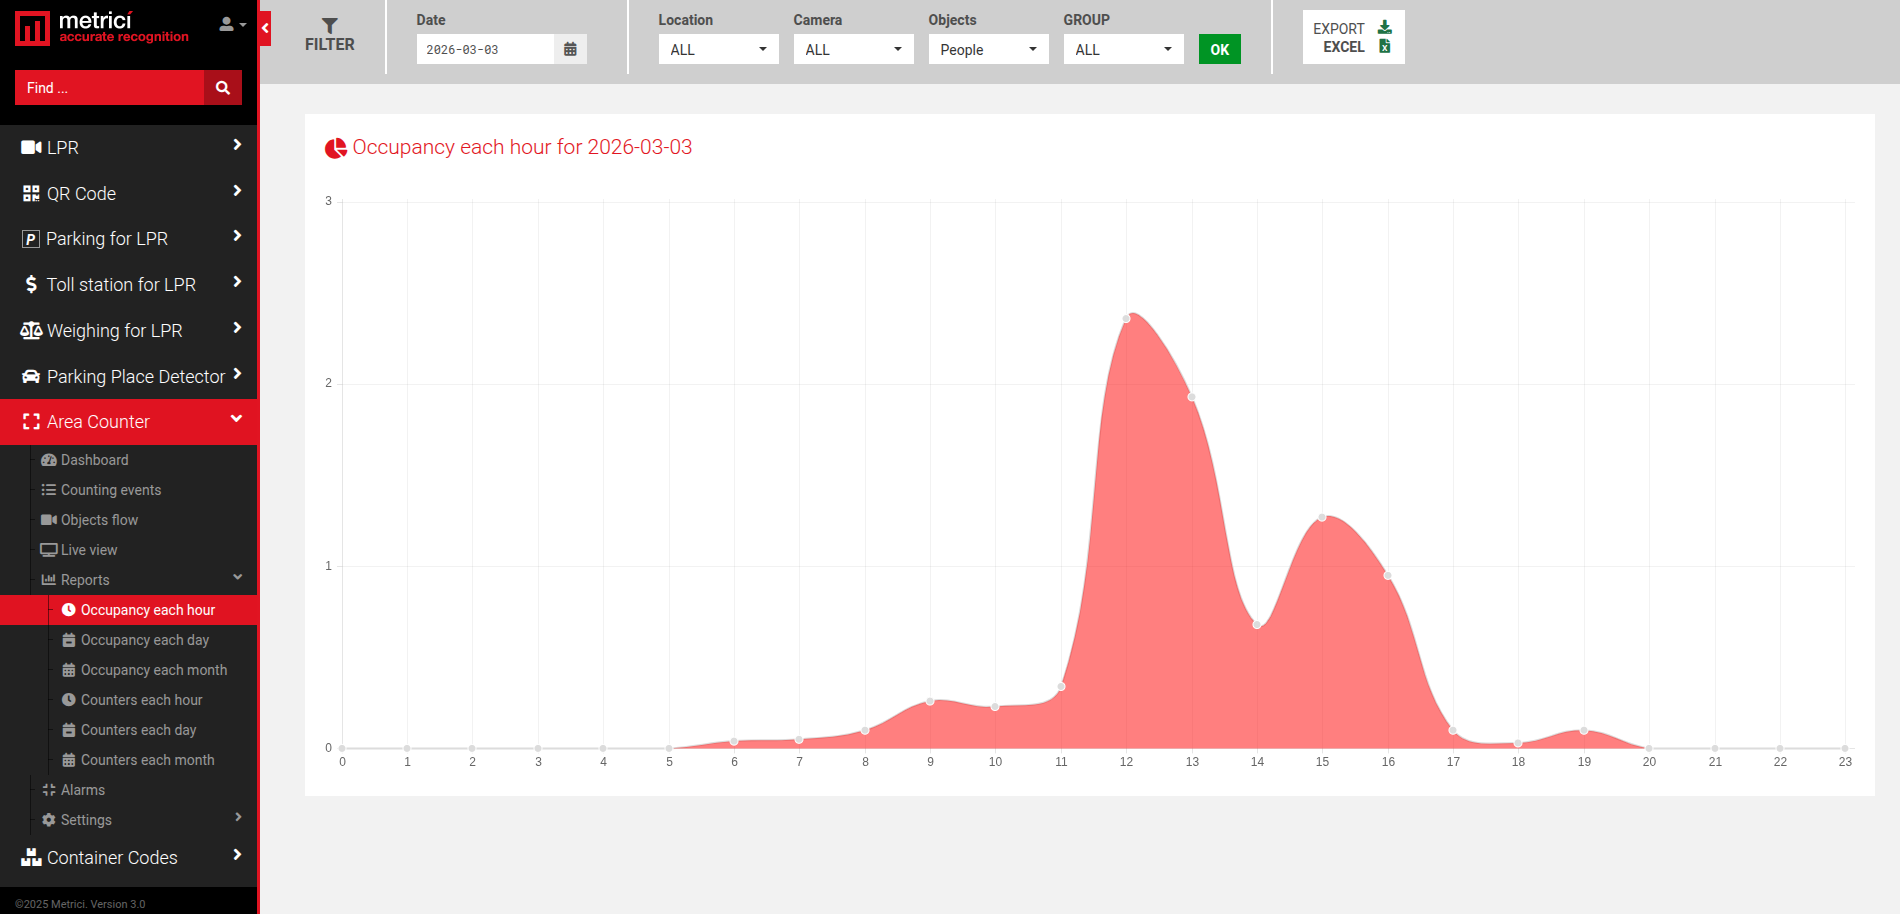
Generates a report showing the occupancy percentage of a location, camera, object type, or group for each hour within the selected time interval.
Occupancy Each Day
Generates a report showing the occupancy percentage for each day. By default, the current week is displayed, but a different time interval can be set using the filters.
Occupancy Each Month
Generates a chart with the comparative occupancy percentage for the selected criteria. By default, the system generates a report for the current year, from the beginning of the year to today. These dates can be adjusted in the filter menu.
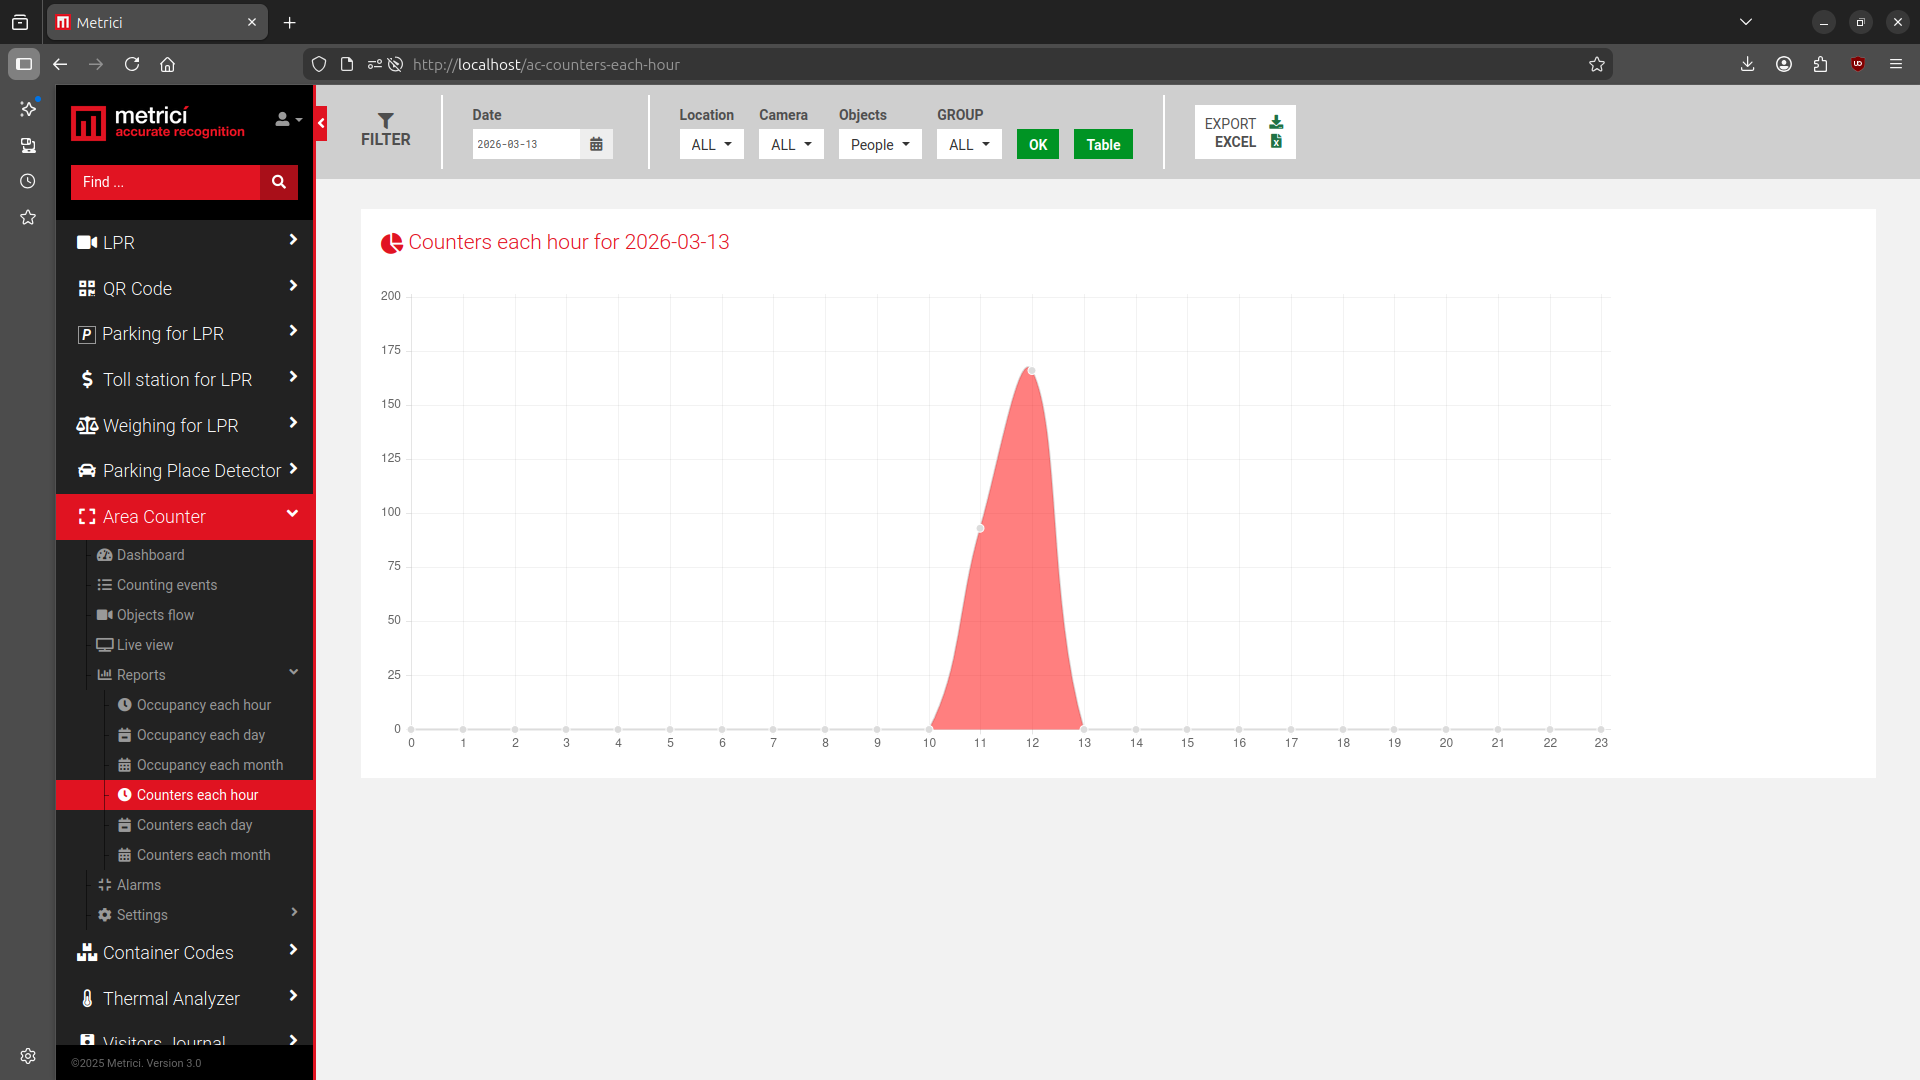
Counter Each Hour
Generates a report showing the absolute number of detected objects per hour for a location, camera, object type, or group within the selected time interval.
Counter Each Day
Generates a report showing the absolute number of detected objects for each day. By default, the current week is displayed, but a different time interval can be selected using the filters.
Counter Each Month
Generates a chart with the total number of detected objects for each month. By default, the system generates a report for the current year, from the beginning of the year to today. These dates can be adjusted in the filter menu.
Alarms
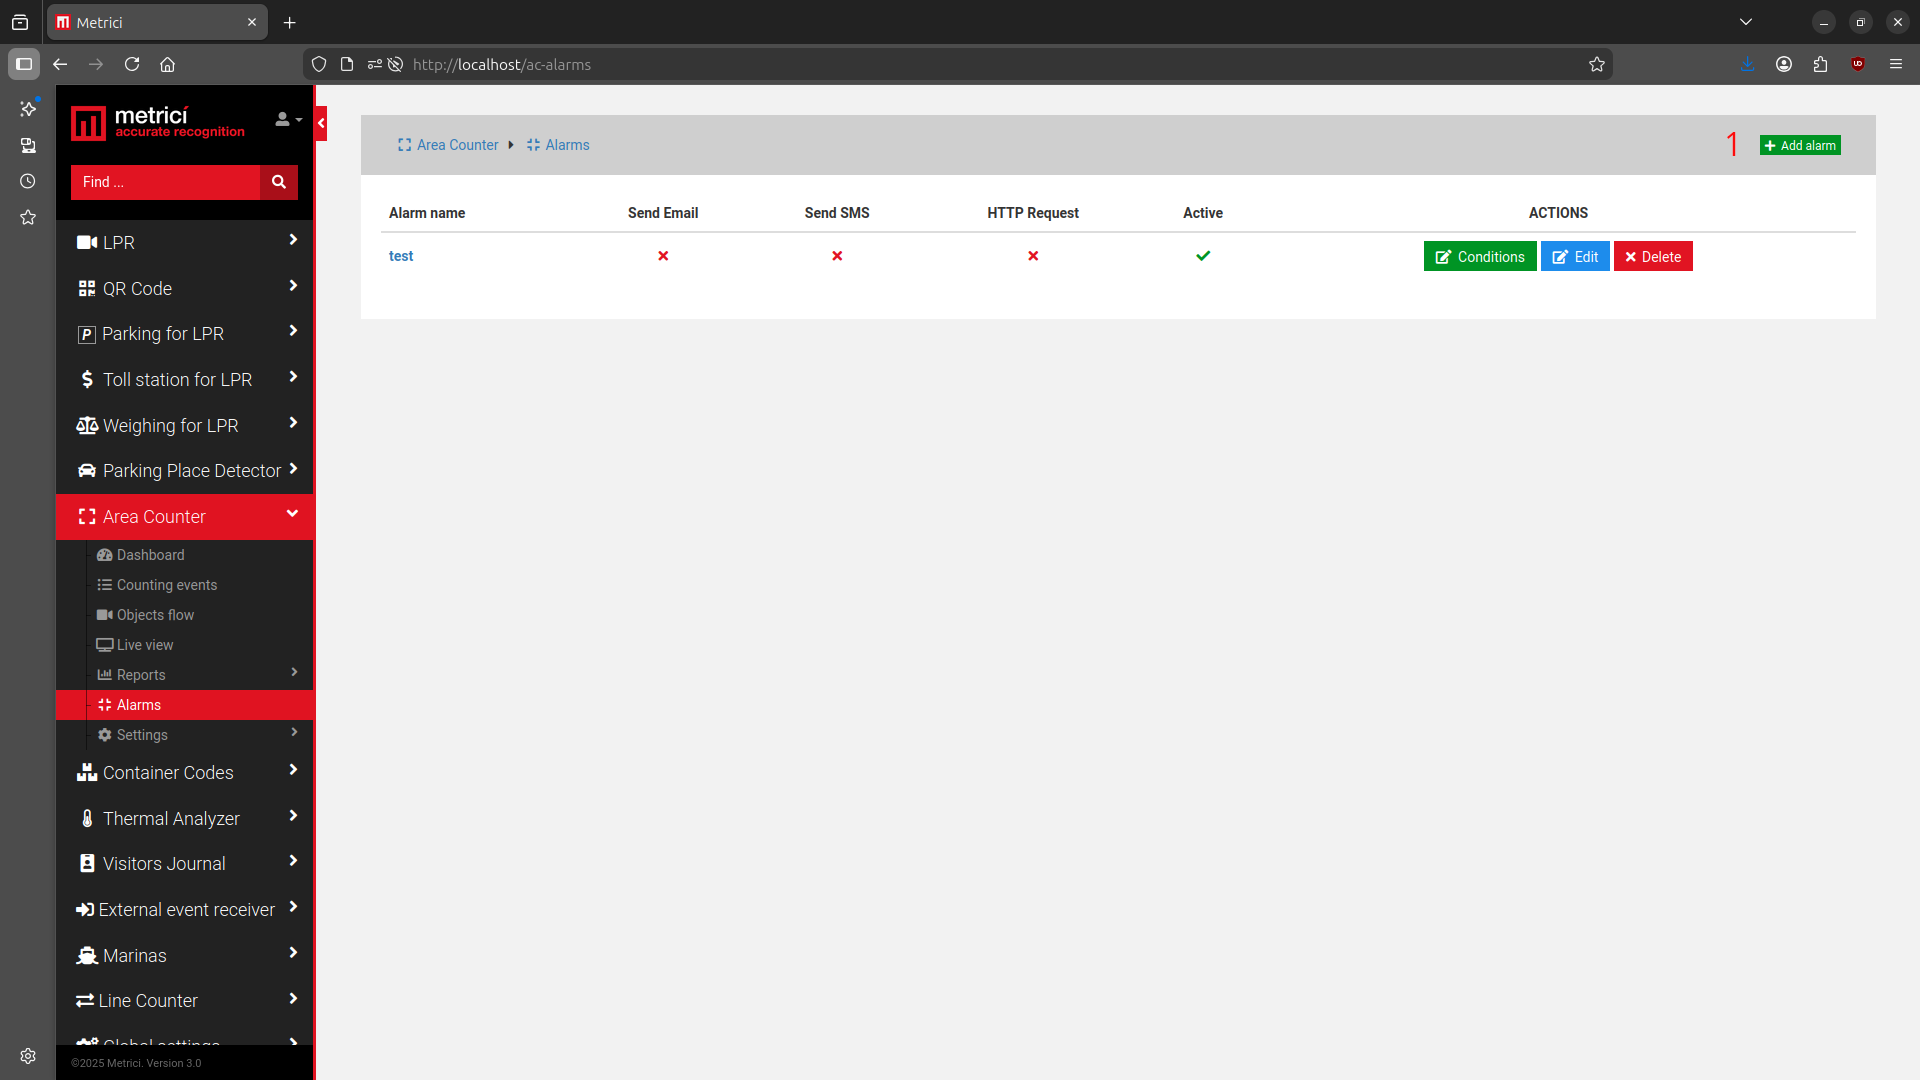
Each location or zone can have its own alarm that triggers when one or more conditions are met. To add an alarm, click the green Add Alarm button in the upper right corner of the menu — see Fig.42 Alarm (1).
Alarm Types
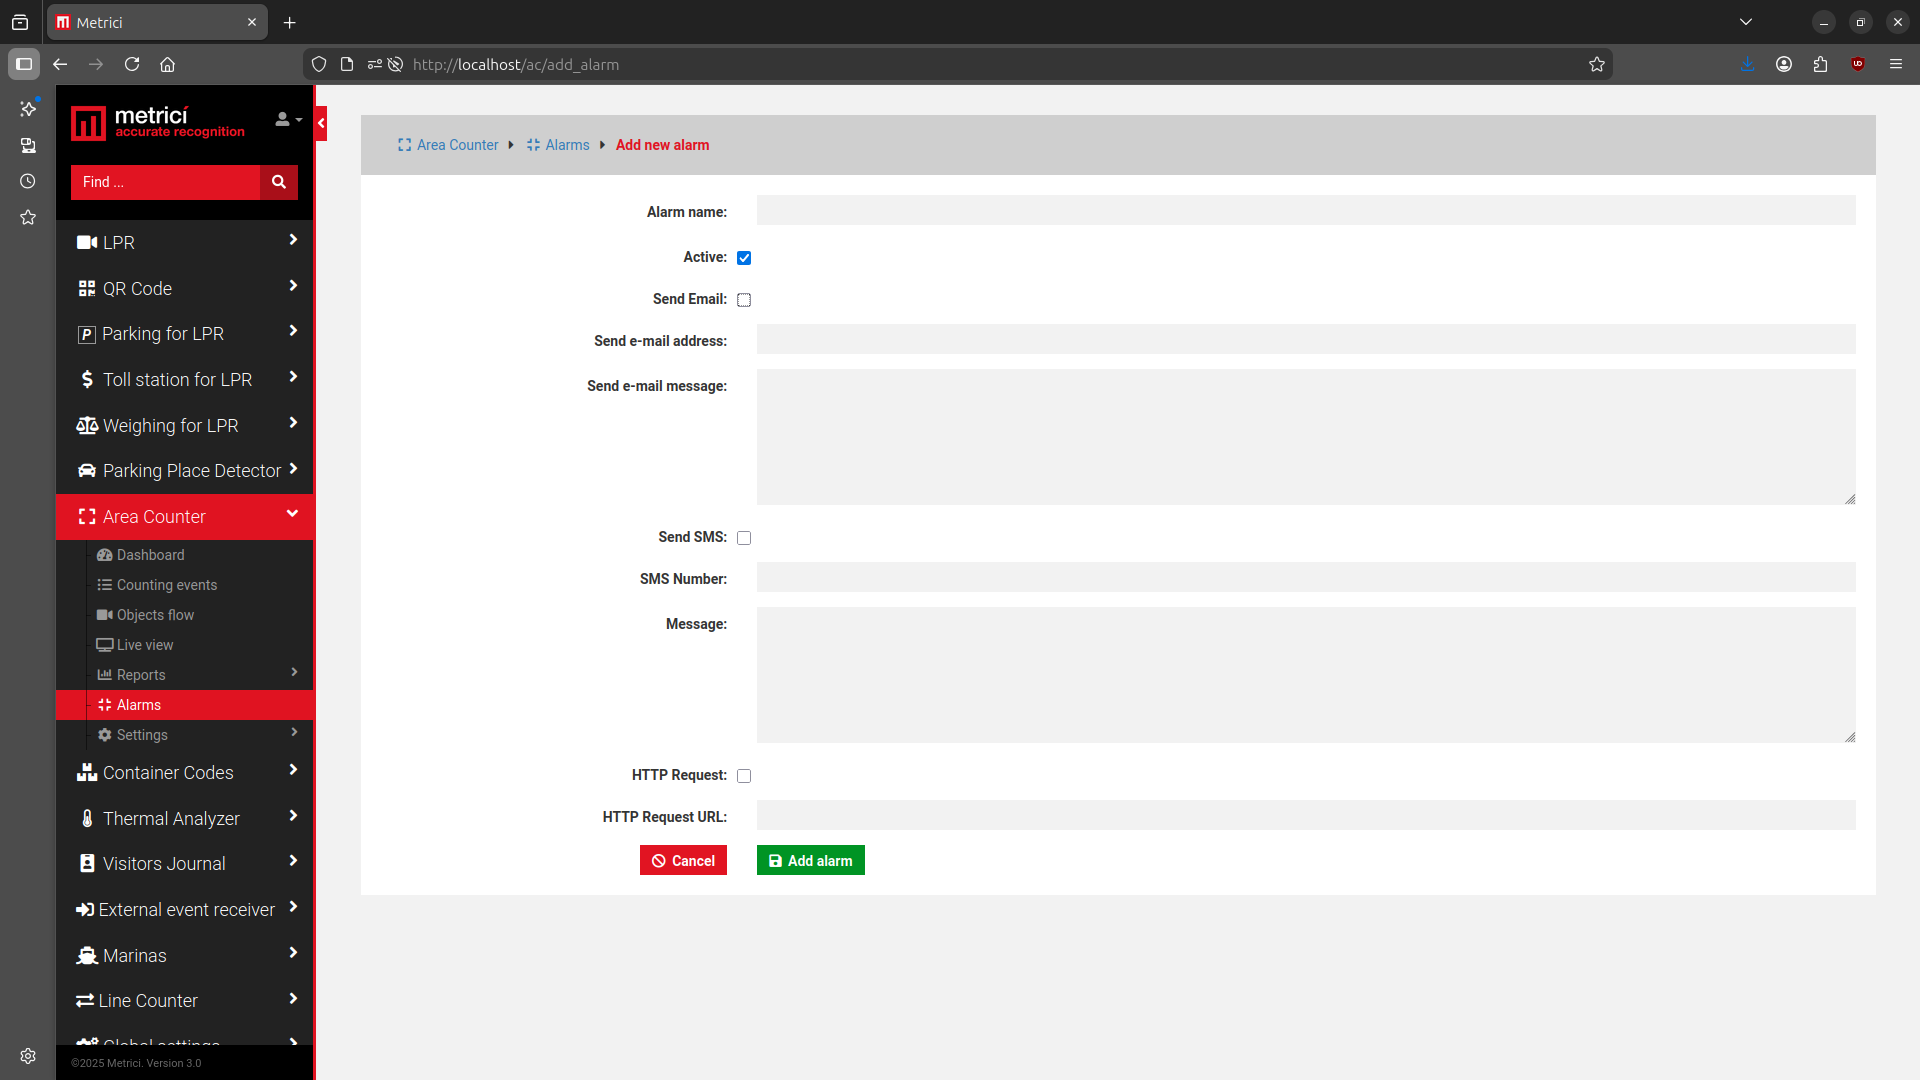
An alarm can be set as active or inactive and can be one of three types:
- Email — enter the recipient's email address and customize the message that will be delivered.
- SMS — check the Send SMS box, enter the phone number, and write the message to be delivered. A GSM module must be attached to the server. Each phone number requires its own separate alarm — multiple phone numbers cannot be set in a single alarm.
- HTTP Request — the alarm triggers a URL when activated, allowing it to control a barrier, traffic light, or any other device that communicates over HTTP.
Setting Up Conditions
After creating an alarm (giving it a name and selecting a type), you must define the conditions under which the alarm will activate. Click the green Add Conditions button to add new conditions. You can add as many conditions as needed.
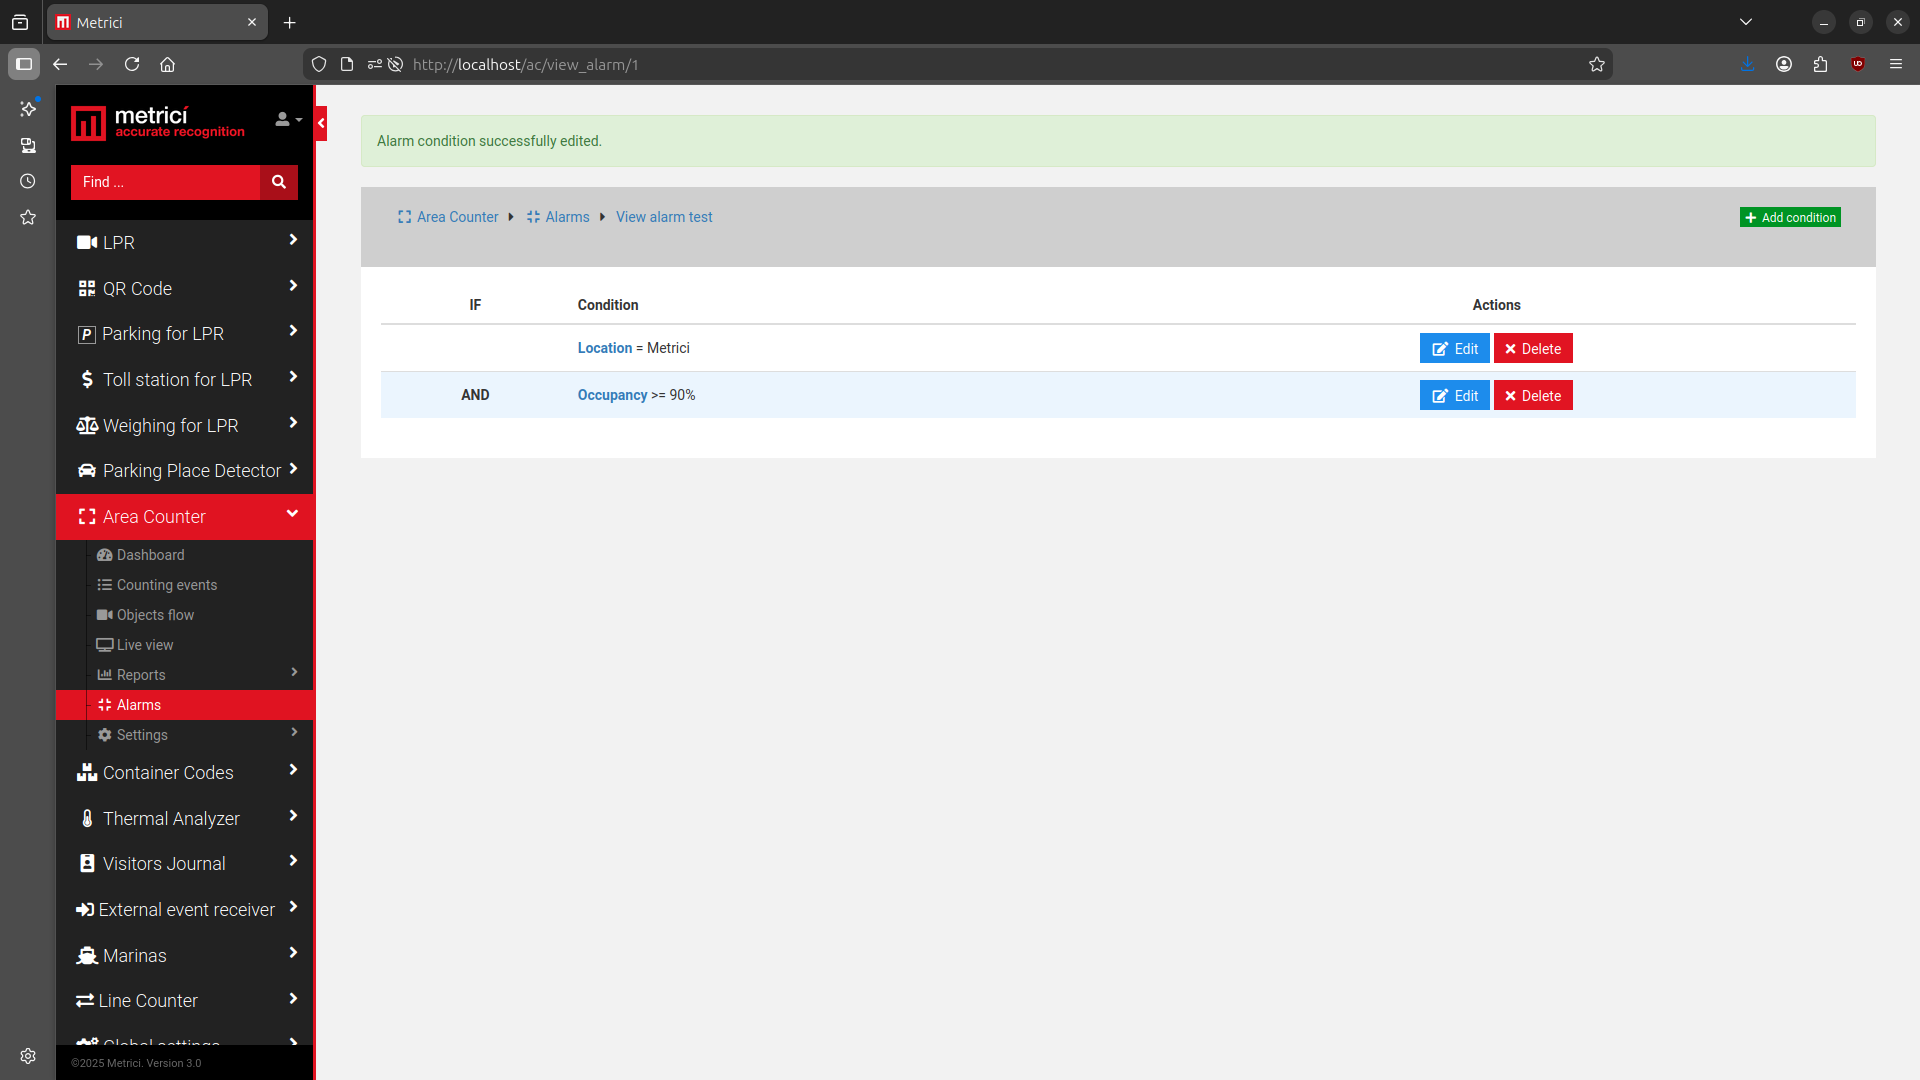
The first condition requires selecting an Alarm Item — see Fig.45 Alarm Conditions (1):
| Alarm Item | Available Conditions |
|---|---|
| Location | Occupancy percentage — set the threshold at which the alarm activates. |
| Group | Select which group or groups the alarm applies to, along with a percentage or number threshold. |
| Zone | Select the specific zone and set a status or counter condition. |
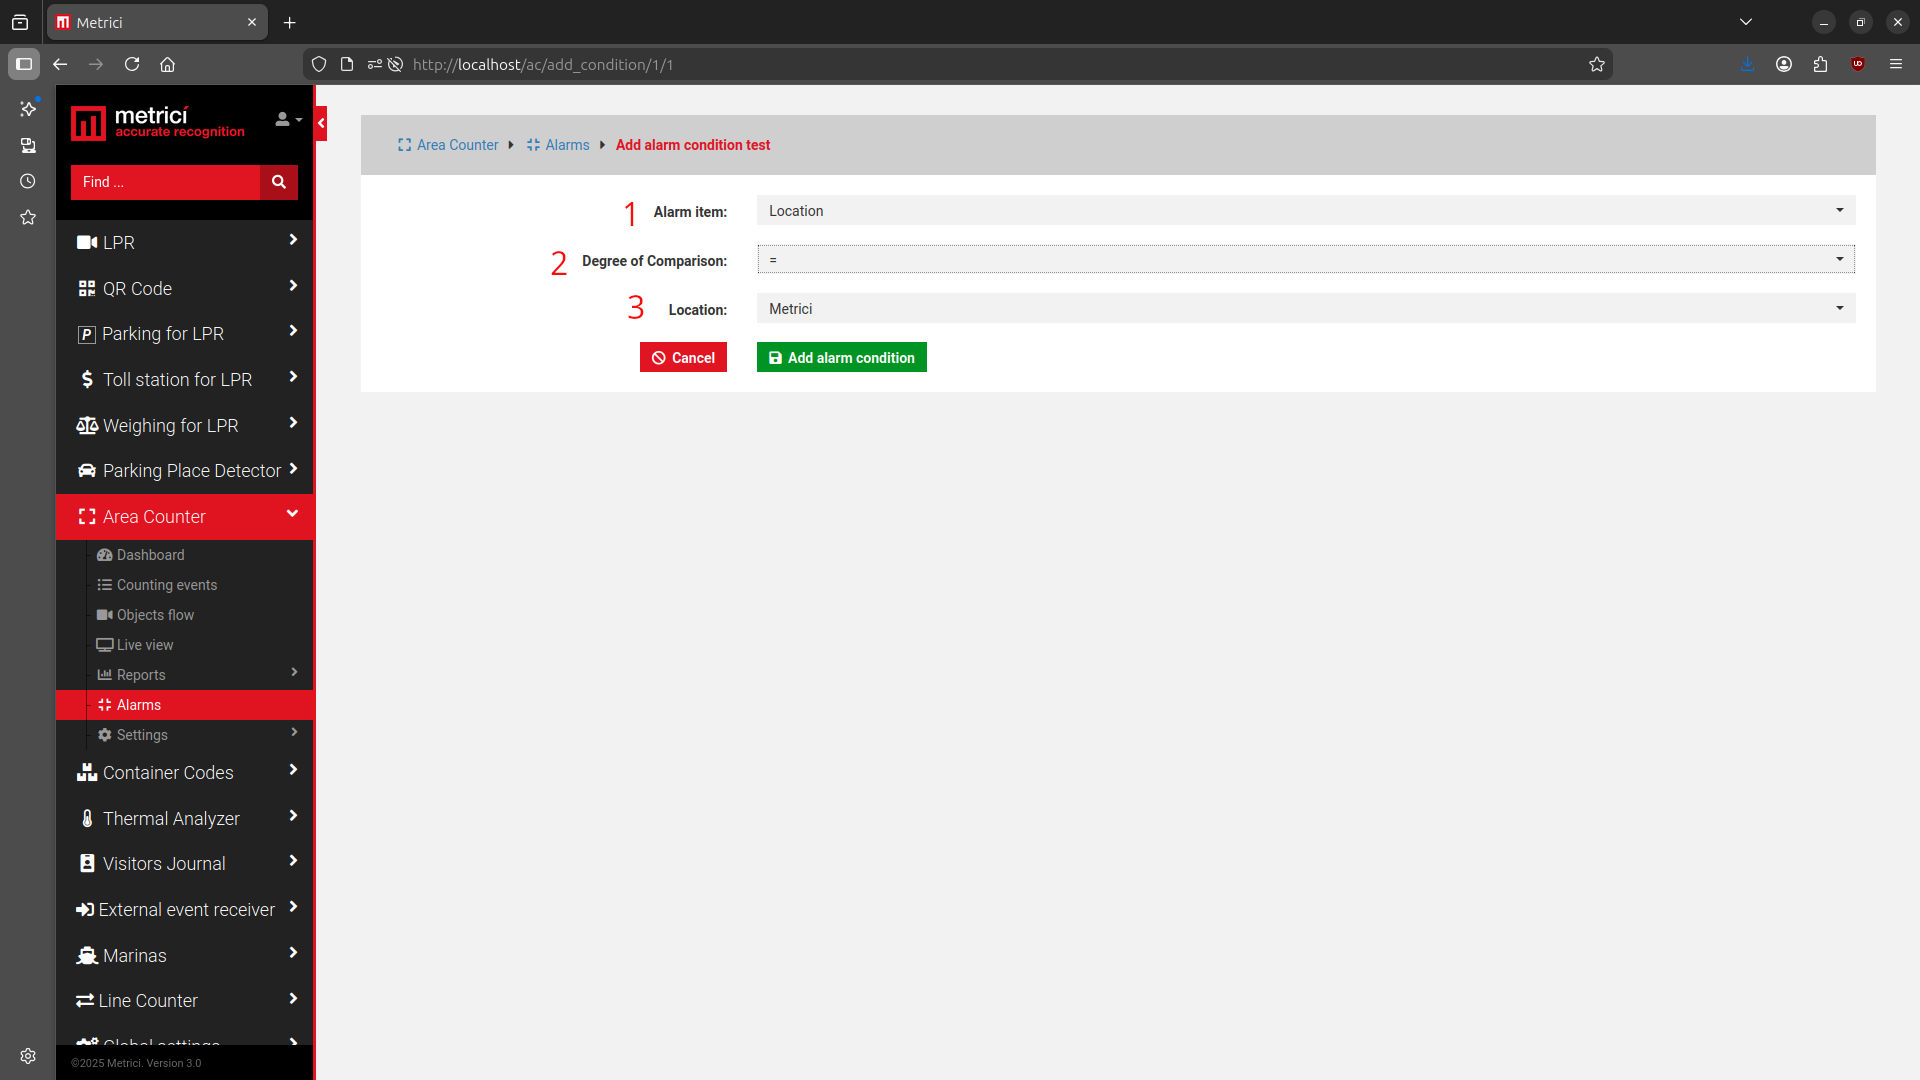
Comparison Operators
| Operator | Meaning |
|---|---|
= | Is equal to a specific value. |
!= | Is different from / not included in the alarm item. |
< | Smaller than (typically used with time units). |
<= | Smaller than or equal to (used with time units or percentages). |
> | Greater than (typically used with time-based conditions). |
>= | Greater than or equal to (used with time units or percentages). |
Examples
Example 1: Alert when a zone has been occupied for more than 1 minute.
- Alarm Item: Zone = select the zone
- Condition: Counter > more than
- Value: 1 minute
Example 2: Alert when a location is almost full.
- Alarm Item: Location = select the location
- Condition: Occupancy >= 90%
Settings — Locations & Cameras
Only locations that have been created in Global Settings will appear in this menu. For a location to be displayed in Area Counter, it must have at least one camera assigned to it.
For any location, you can edit the cameras that were allocated to it in Global Settings. For each camera, you must set a maximum capacity of objects that can fit in the zone and register it — for example, how many vehicles can fit in a zone, or how many people.
The capacity is essential for the system to properly calculate occupancy reports and generate accurate statistics. If the capacity information is not accurate, the reports will not be either. Similarly, if a zone is not registered, its events will not appear in the database.
To register a zone, choose a location from your list and click on its name. From the list of cameras in that location, select the one for which you want to register the capacity.
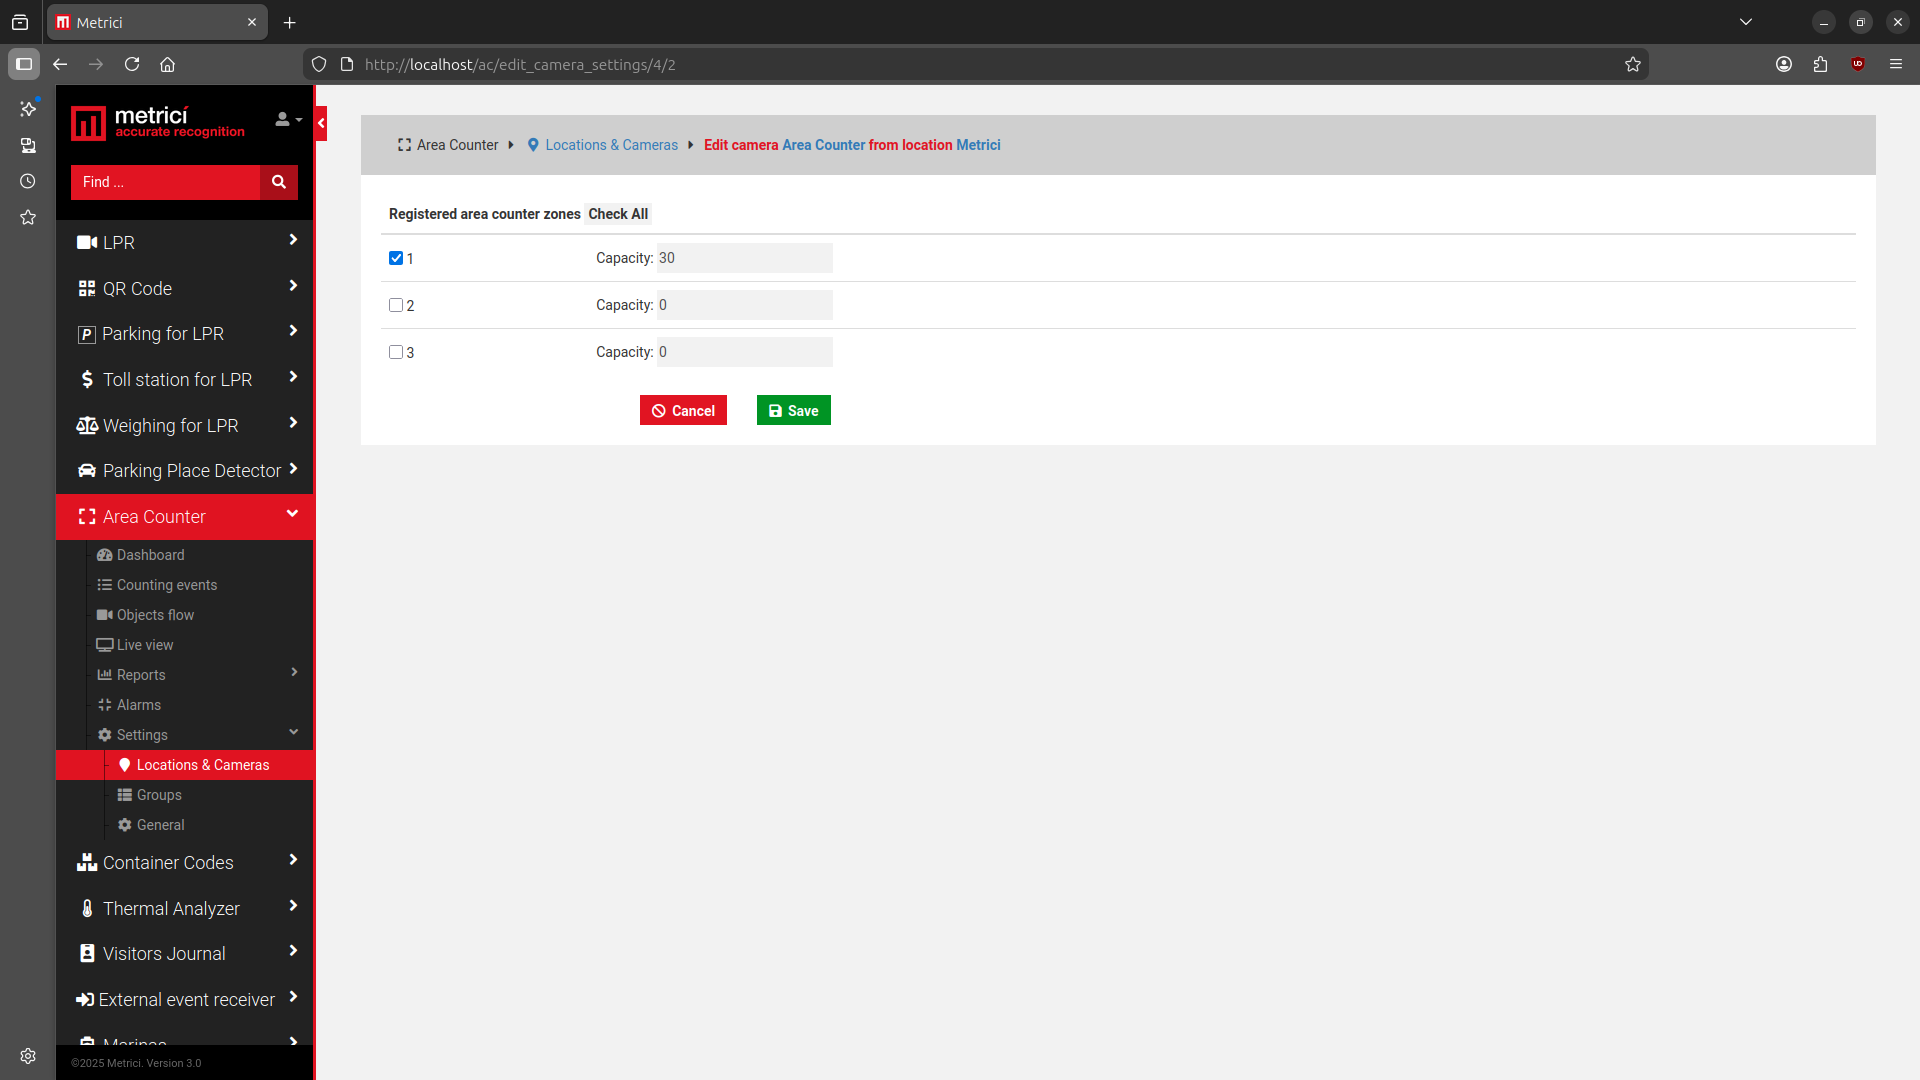
If a zone becomes unavailable due to reconfiguration, maintenance, or any other reason, it can be unregistered so that it is no longer taken into account when calculating occupancy percentages.
Communication with LED Display
If you want to display information about available spaces on a Metrici LED Display, navigate to Area Counter → Settings → Locations & Cameras. From the list of your locations, click the blue Edit button.
In the Display Text field, you can use special codes to instruct the Metrici LED Display what to show — see Fig.47 Display (1). For example:
#YCapacitate=#CAPACITY3 #RContor=#COUNTER3 #GDisponibil=#AVAILABLE3
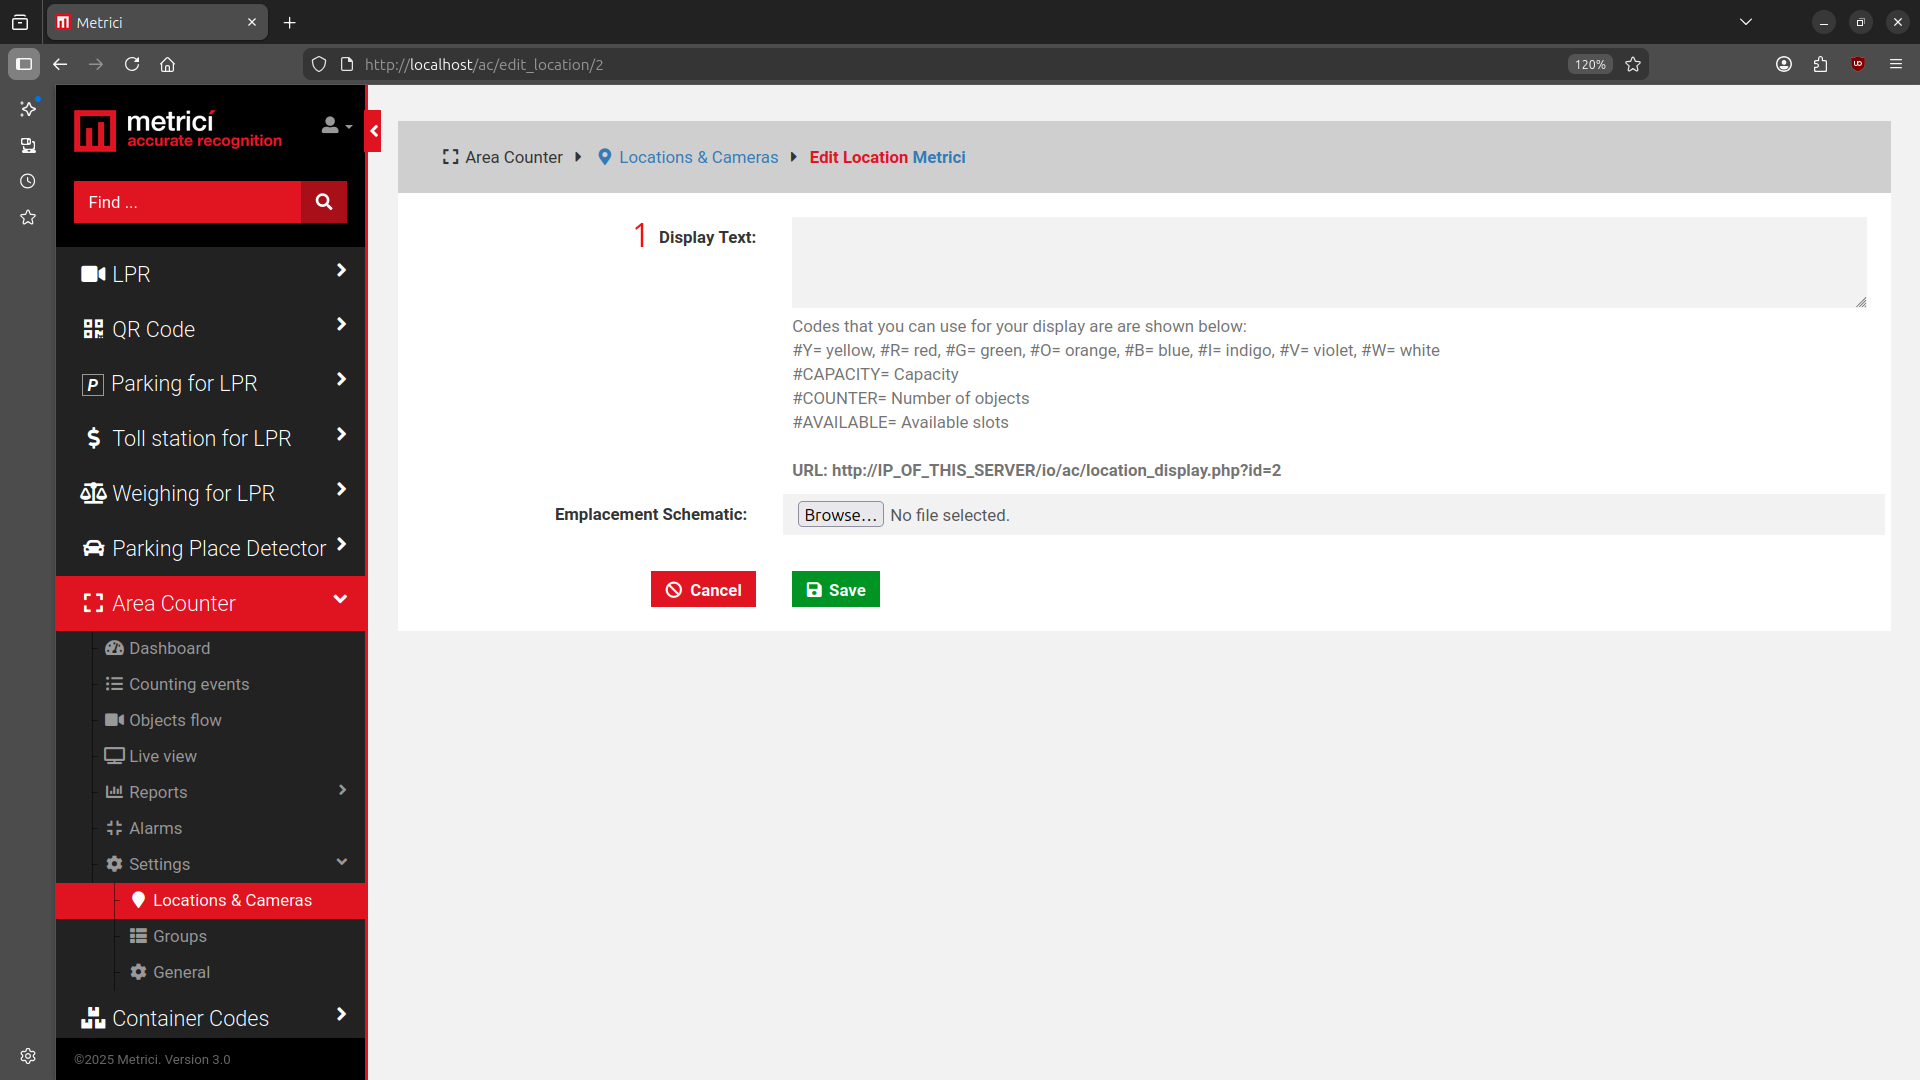
Color Codes
| Code | Color |
|---|---|
#Y | Yellow |
#R | Red |
#G | Green |
#O | Orange |
#B | Blue |
#I | Indigo |
#V | Violet |
#W | White |
Data Codes
| Code | Description |
|---|---|
#CAPACITY3 | Displays the total capacity using a maximum of 3 characters. |
#COUNTER3 | Displays the current number of objects using a maximum of 3 characters. |
#AVAILABLE3 | Displays the number of available slots using a maximum of 3 characters. |
The number after the code (1–9) defines how many characters to use for the display. If the number of characters exceeds the physical size of the LED Display, the information will scroll.
On your Metrici LED Display interface, fill in the auto-generated URL such as:http://IP_OF_THIS_SERVER/io/ac/location_display.php?id=11
For more details, refer to the Metrici LED Display user and integration guides.
Groups
A group is a collection of multiple zones that share a specific characteristic, defined by the administrator. Groups can also be used to deliver consolidated information to a Metrici LED Display.
A group can include any number of zones from any number of cameras. Not all zones from a single camera need to be included — you can select only the ones that are relevant.
Creating a Group
- Click on a location name where you want to create a group.
- Click the green Add Group button in the upper right corner.
- Choose a name for the group, select what objects are included, and enter the display codes for the Metrici LED Display (if applicable) — see Fig.48 Group Settings.
- Click Save.
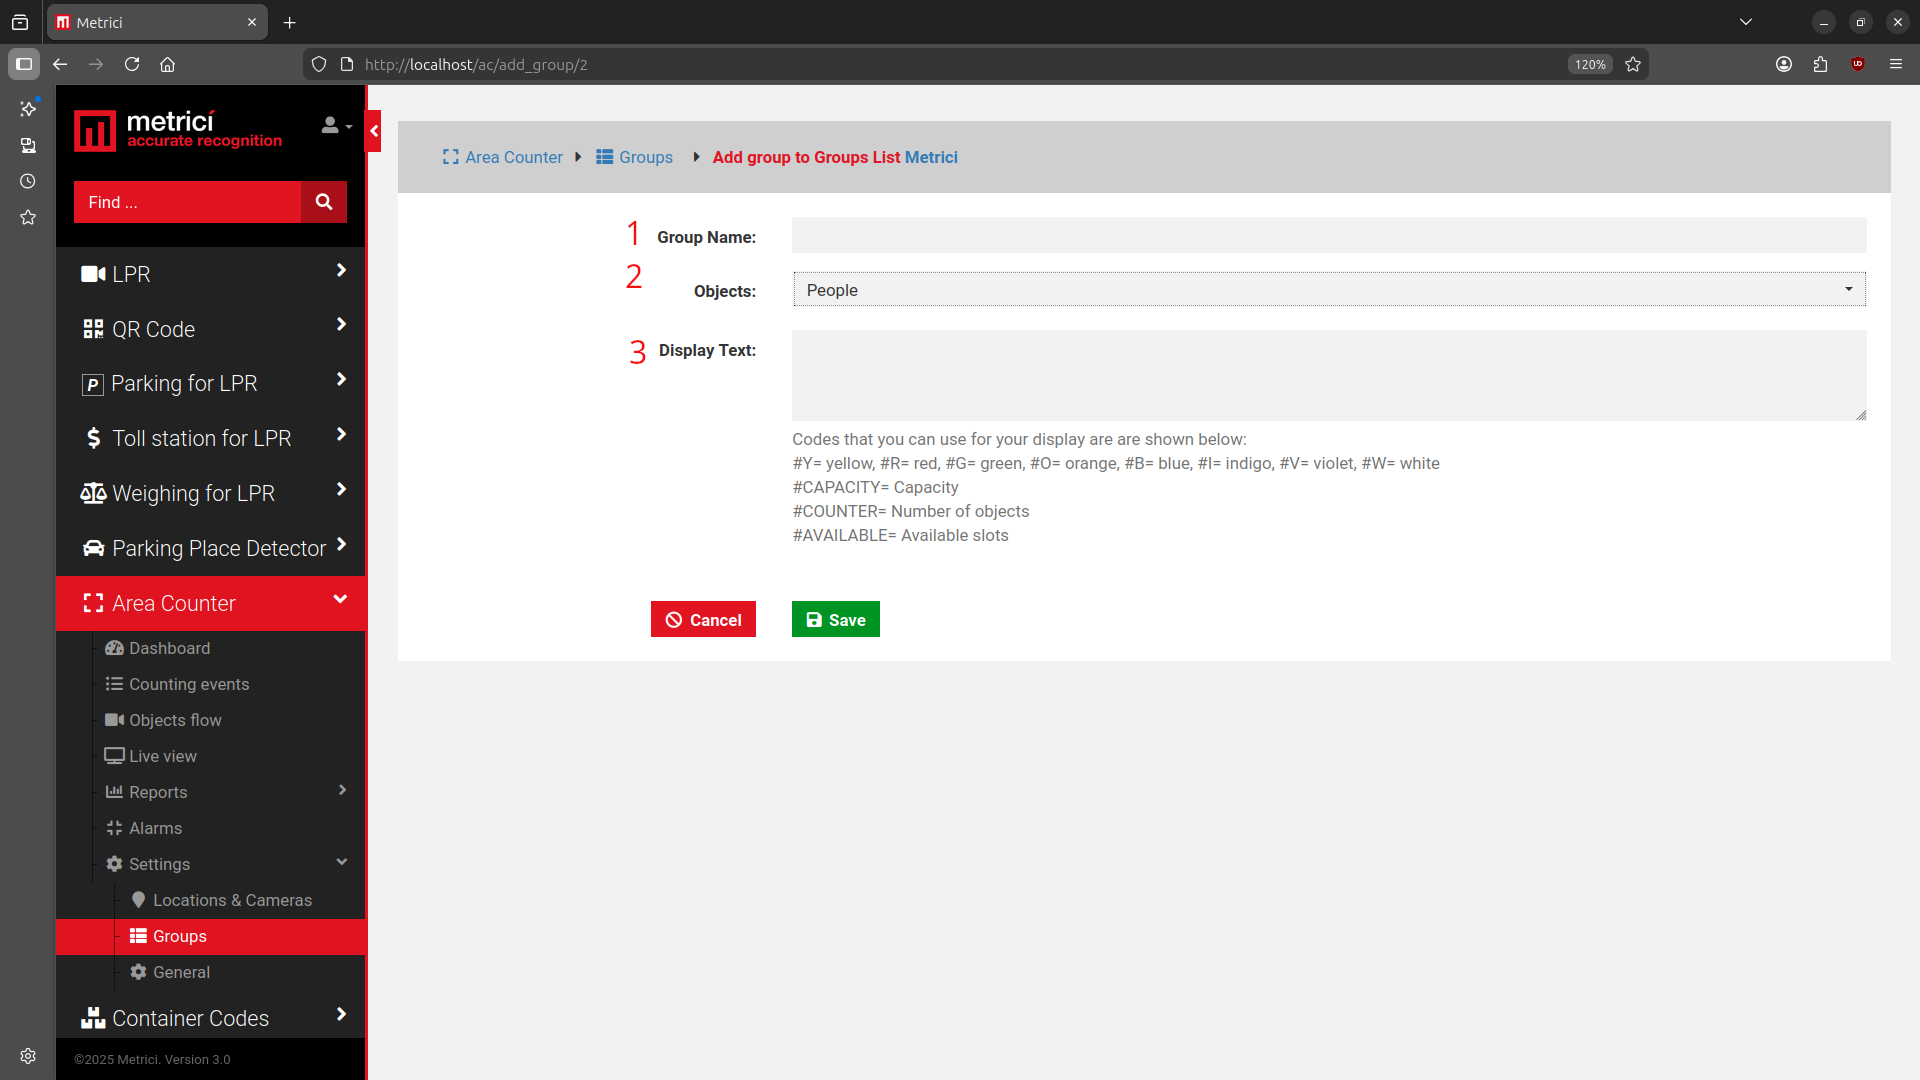
Managing a Group
- Go to the list of groups and click on a group name or the green View button.
- From the list of zones available in that location (across all cameras), click on the ones you want to add to the group.
- You can add or remove zones from a group at any time by clicking its name or the View button.
Location Plan
For easier management, a floor plan or map of a location can be uploaded to the Metrici Interface. This provides an instant visual overview of the entire location with live data overlaid.
Uploading a Plan
- Navigate to Area Counter → Settings → Locations & Cameras.
- From the list of locations, click the Edit button for the location you want to add a map to.
- In the Emplacement Schematic section, choose the file you want to upload, select it, and click Save.
.png or .jpeg format.Drawing Zones on the Map
- Go back to Area Counter → Settings → Locations & Cameras.
- From the list of cameras in the location, select one by clicking on its name.
- In the menu that opens, click the Edit Plan button.
- Select a previously registered zone and manually draw the perimeter for that zone on the map by placing points.
- Click Save.
- Repeat this process for each camera in the location.
Once all zones have been drawn, the Dashboard menu in Area Counter will display an instant view of the location with live detection data from each camera overlaid on the map.