Metrici RGB LED Display
User Manual for End Users and System Administrators

Introduction
The Metrici RGB LED Display is a network-connected, full-colour LED matrix designed to show live operational data from a Metrici system — free parking spaces, vehicle speed, license plate numbers, weighbridge readings, platform assignments, directional arrows, or any custom text the system needs to broadcast. The unit runs an embedded configuration interface (documented in the rest of this manual) and is intended for permanent indoor or outdoor mounting.
Standard Models
Two standard formats are available, with custom sizes produced on request:
- Compact panel — approximately 32 × 16 cm, 64 × 32 pixels, fitting around three large characters per row. Up to ten or more panels can be chained in a single row. Typically used for per-row parking signage, including a configurable direction arrow.
- Large display — approximately 65 × 33 cm, 128 × 64 pixels, with one to three rows of text at up to twelve characters per row. Used for road speed warnings, transport platforms, ferry waiting times and plate-number readouts.
Custom sizes share the same housing, ingress rating, RGB capability, network connectivity and configuration interface as the standard range.
Hardware Highlights
- Anodised aluminium housing rated IP66 — dust- and water-protected for permanent outdoor mounting.
- Operating range −20 °C to +50 °C.
- Long-life LEDs rated for 100,000+ hours of operation.
- Built-in WiFi and Ethernet — no external controller required.
- Full RGB colour, configurable per line of text.
Typical Applications
- Parking free-space indicators (per row, zone, floor or site total), driven by the Parking for LPR module or the Parking Place Detector.
- Speed warning signs paired with Metrici Observer Radar.
- Truck plate-number and bay assignments at logistics platforms.
- Weighbridge readouts visible directly to the driver.
- Port, ferry and industrial site signage.
- Production counters and zone instructions driven by Area Counter and Line Counter.
What This Manual Covers
This manual documents the embedded configuration interface that runs on the display itself, accessible from any device on the same network at port 3000. From there you can choose between API-driven content (live data from the Metrici Web Interface) and static text, configure per-line text/colour/font or polling settings, tune low-level panel parameters, manage network and credentials, and inspect logs and updates.
Configuration of the data sources themselves — Parking for LPR, Area Counter, Line Counter and Parking Place Detector — lives in the Metrici Web Interface manual; Section 8 – Web Application Integration of this document covers the codes and URLs you need to connect the two.
For full hardware specifications, dimensions and ordering options, see the Metrici LED Display product page on the Metrici website.
1. Getting Started
- Open a web browser (Chrome, Firefox, Edge, Safari, etc.) on any device that is connected to the same local network as the Metrici RGB Display.
- Enter the IP address that is shown on the physical display, or use the default address
192.168.100.40. The display listens on port3000, so the full URL has the formhttp://<display-ip>:3000(for example,http://192.168.100.40:3000). If you are unsure of the address, ask your system administrator. - You will be presented with a Login screen — see Login. The default credentials are:
- Username:
metrici - Password:
metrici
- Username:
2. Main Dashboard
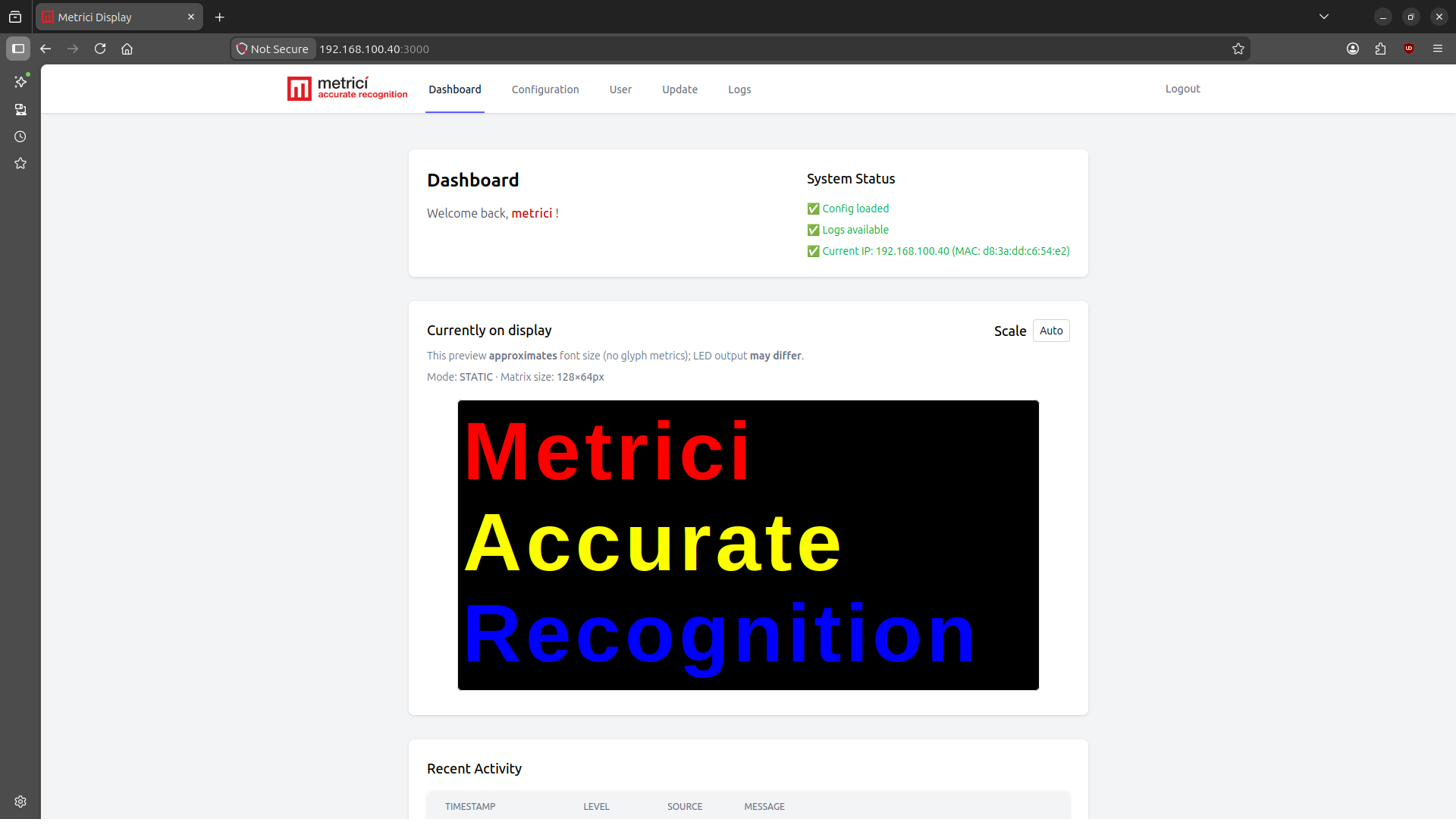
After a successful login you are taken to the Dashboard, which gives you a quick overview of the device — see Fig.1 Dashboard.
- System Status – three colour-coded indicators in the top-right corner:
Config loaded– a valid configuration has been read.Logs available– recent activity logs are accessible.Current IP– the IP address the device is currently using, together with its MAC address.
- Currently on display – a live miniature preview of what the LED matrix is showing in real time. The preview shows the current operating mode (e.g.
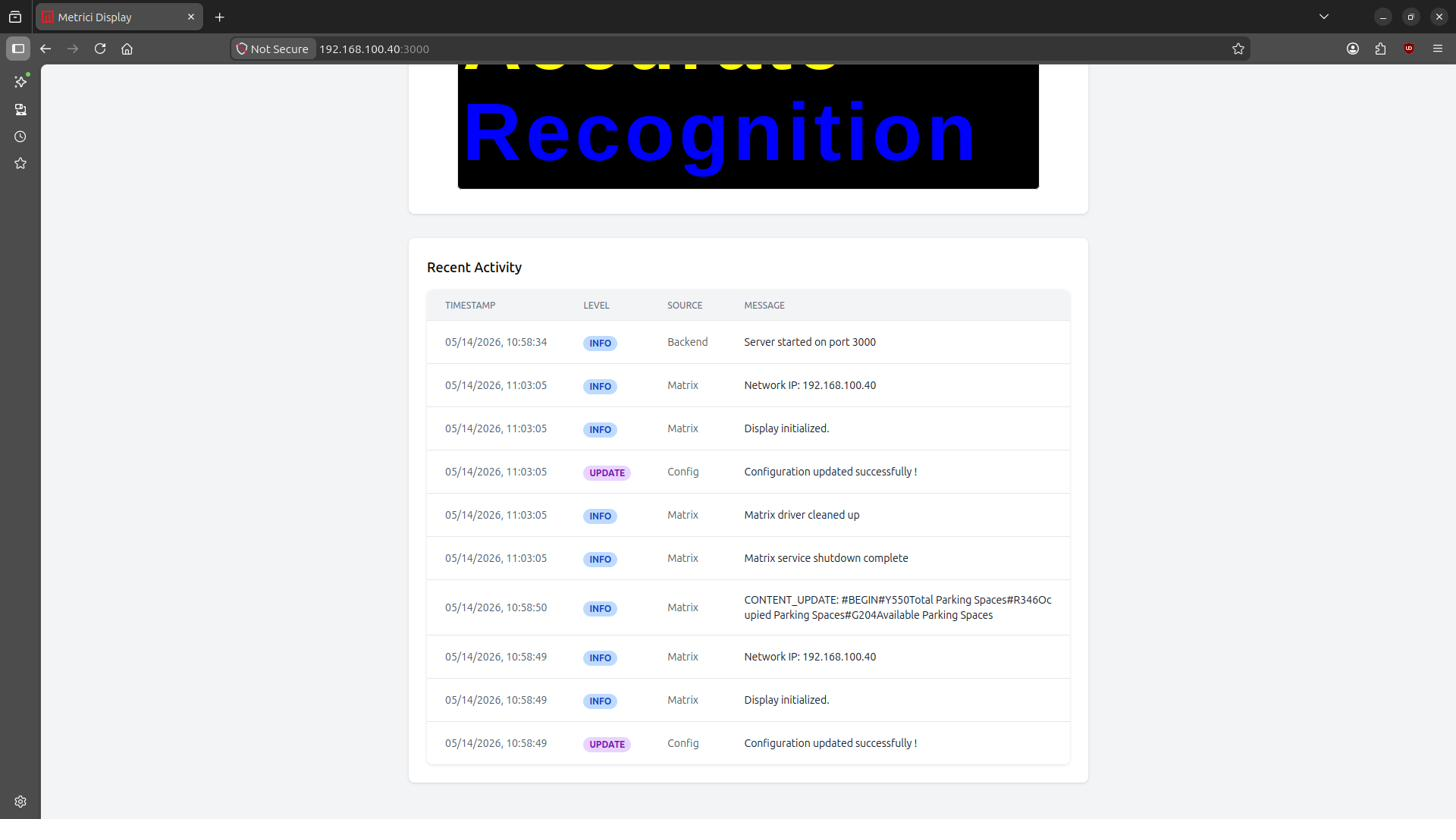
STATICorAPI) and the matrix size in pixels (e.g.128×64px). Use the Scale selector in the upper-right corner of this panel to switch betweenAutoand fixed zoom levels. - Recent Activity – a list of the latest log entries, with a timestamp, a colour-coded severity badge (Info – blue, Update – purple, Warning – yellow, Error – red), the source of the event (
Backend,Matrix,Config) and a short message.
4. Configuration Page
The Configuration page is where you customise the behaviour of the matrix. It is divided into several sections. By default only the most common settings are shown. To reveal hidden, advanced options, tick the Show advanced config checkbox at the top of the page.
4.1 Display Source
At the top of the page, choose the source of the content that the LED matrix should show — see Fig.3 API Configuration:
- API – the matrix periodically requests data from a remote URL you provide. This is the mode used when the display is driven by the Metrici web application (Parking, Area Counter, Line Counter, PPD).
- STATIC – you fill in up to three lines of fixed text that are displayed continuously.
4.2 API Settings (when API is selected)
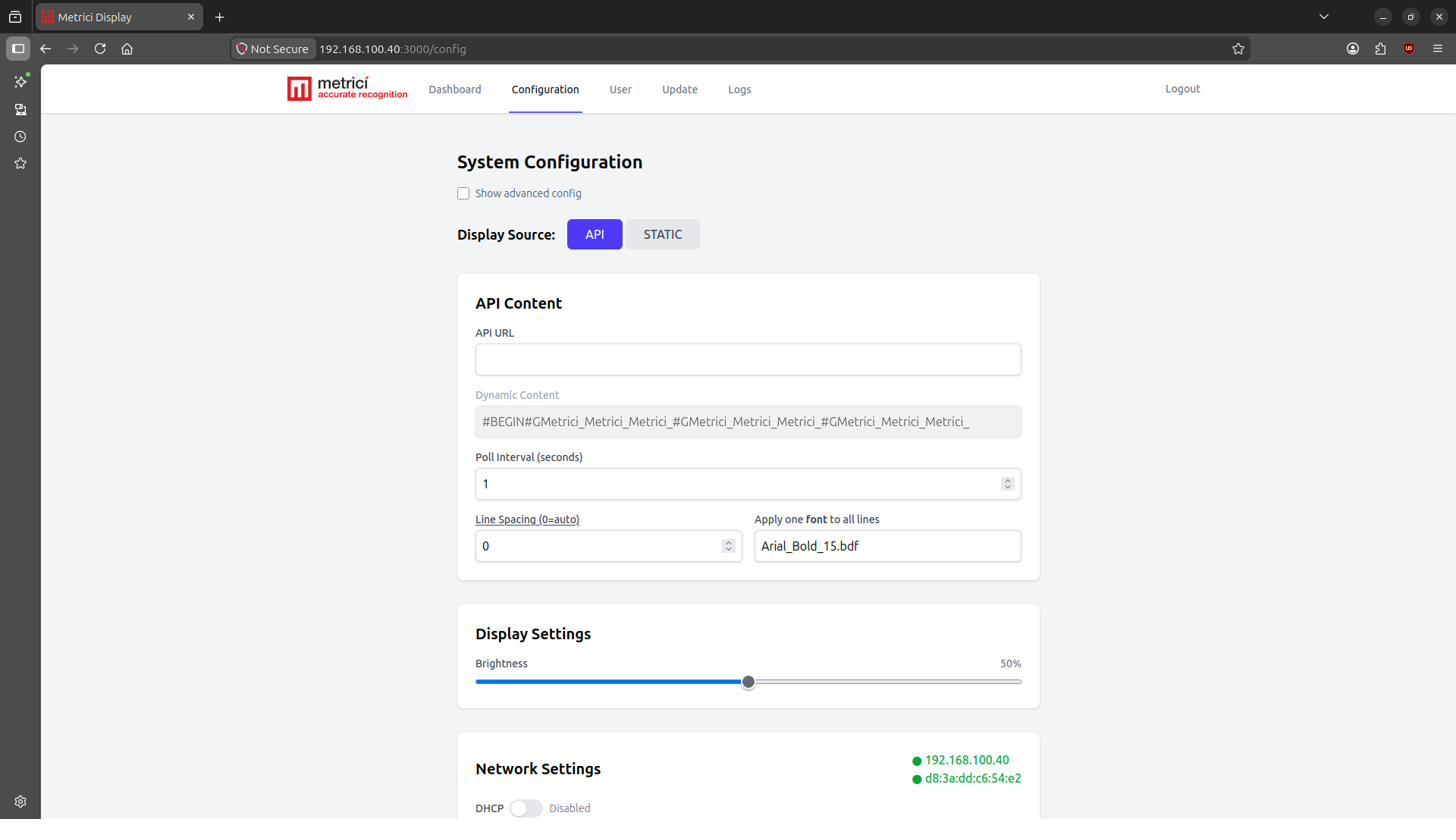
- API URL – the full address from which the matrix fetches its data. When the display is connected to the Metrici web Interface, this URL is generated automatically by the Metrici Interface (see Section 8 – Web Application Integration). A typical value looks like
http://<METRICI_SERVER_IP>/io/lpr/location_display.php?id=1. - Dynamic Content – a read-only preview field that shows the raw text the API is currently returning, including the format codes (e.g.
#BEGIN#GMetrici_Metrici_Metrici_...). This is useful to verify that the endpoint is reachable and is returning the expected payload. You can modify the contents by checking Show advanced config. - Poll Interval (seconds) – how often the matrix queries the endpoint. A value of
1means the display refreshes every second. - Line Spacing (0 = auto) – the vertical spacing between lines, in pixels. Leave at
0to let the device compute the spacing automatically. - Apply one font to all lines – choose a font from the dropdown. The selected font will be applied to every line returned by the API.
4.3 Static Content (when STATIC is selected)
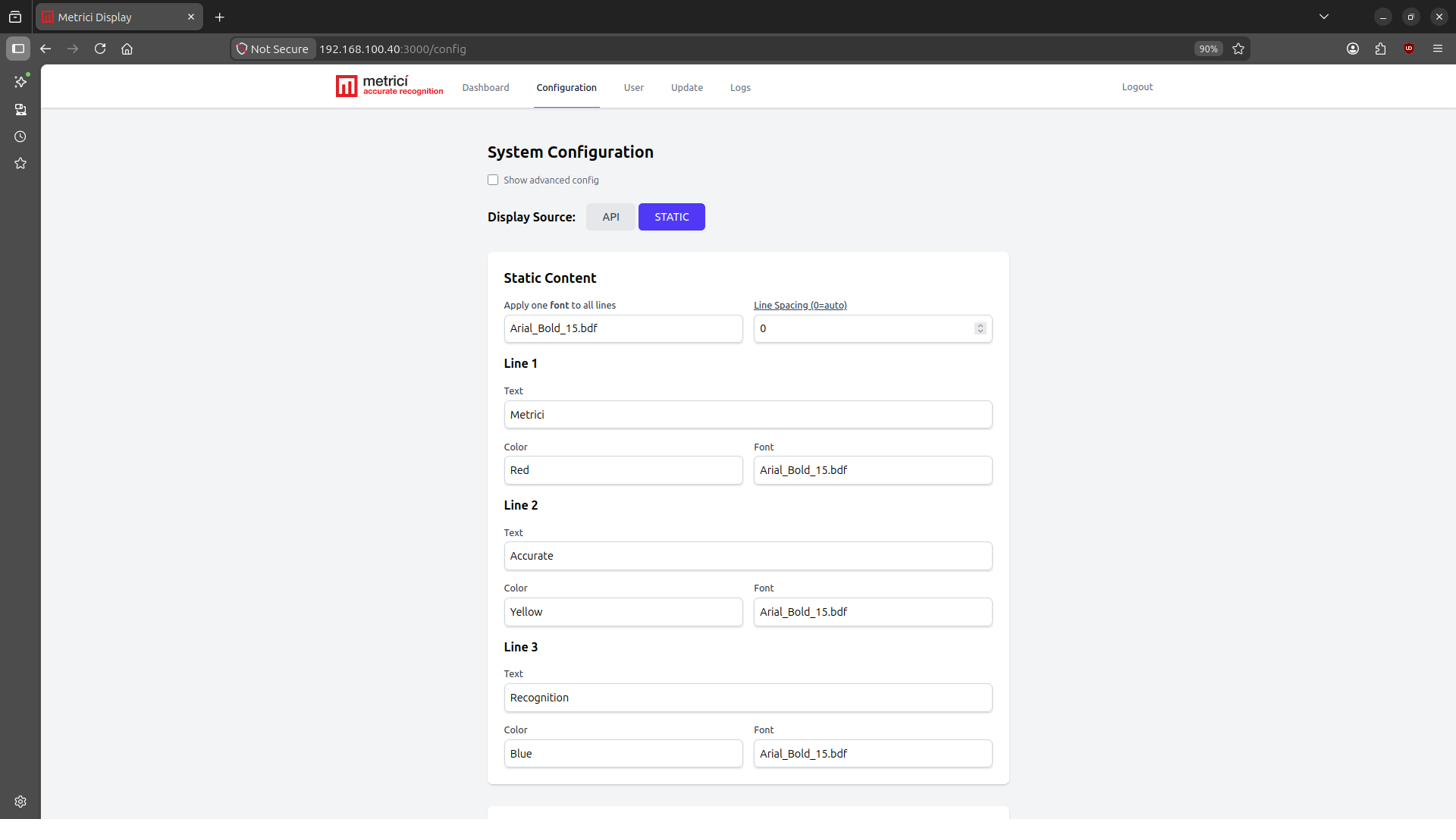
In static mode you can configure up to three lines of fixed text. Each line is independent and has its own settings — see Fig.4 Static:
- Text – the message to display on this line (e.g. Metrici, Accurate, Recognition).
- Color – the colour the text will be rendered in (Red, Yellow, Blue, Green, Orange, Indigo, Violet, White).
- Font – the font used for that particular line (e.g.
Arial_Bold_15.bdf).
Above the per-line configuration, two global controls are available:
- Apply one font to all lines – sets the same font for all three lines at once.
- Line Spacing (0 = auto) – the vertical spacing between lines, in pixels. Leave at
0to let the device compute it automatically.
4.4 Display Settings (Brightness)
Use the Brightness slider to make the matrix brighter or dimmer. The current percentage is shown to the right of the slider (e.g. 50%). This control is always visible regardless of the display source.
4.5 Advanced Display Settings
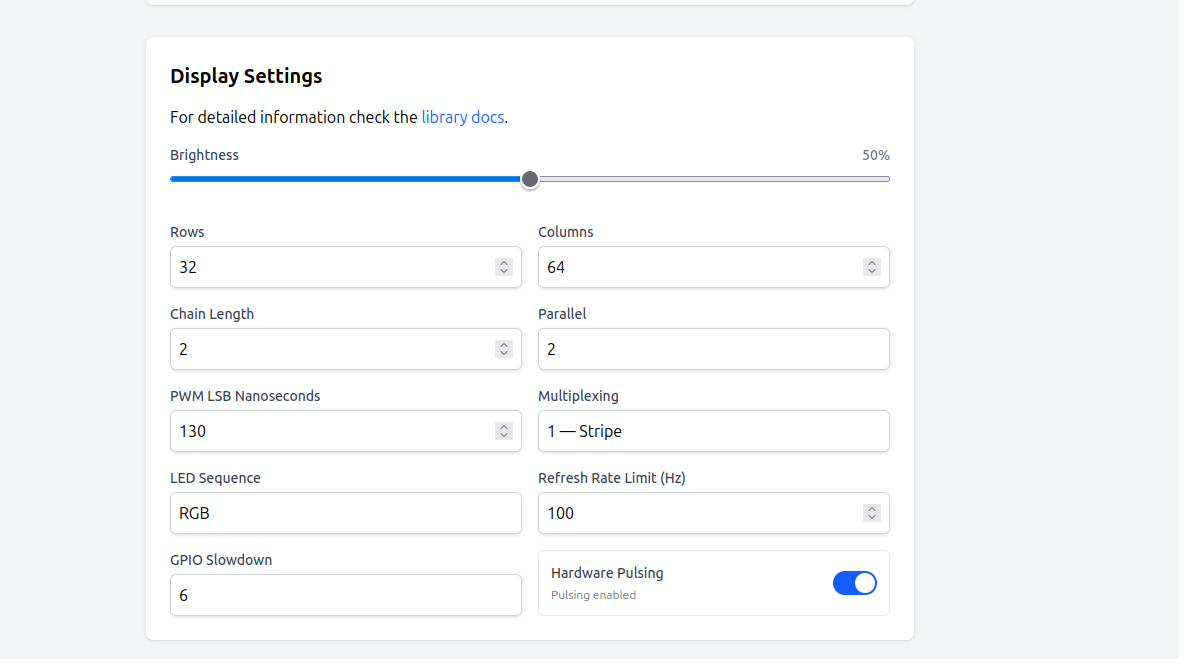
When the Show advanced config checkbox is ticked, additional low-level parameters become available. Internally, the display is driven by the open-source hzeller/rpi-rgb-led-matrix library, and each of the fields below corresponds directly to one of its command-line flags. The link is also exposed inside the interface as “For detailed information check the library docs” — refer to that page if you need the full background.
The values that ship with the device have been chosen to match the panels Metrici delivers; only change them if you are connecting a different panel or are troubleshooting a visual problem — see Fig.5 Advanced Display Settings.
- Rows (library flag
--led-rows) – the number of pixel rows of a single panel. Typical values are16,32or64. The factory configuration is32. - Columns (
--led-cols) – the number of pixel columns of a single panel. Typical values are32or64. The factory configuration is64. - Chain Length (
--led-chain) – the number of panels connected one after another using the panel's input/output connectors. Each additional panel reduces the achievable refresh rate. - Parallel (
--led-parallel) – the number of independent panel chains connected in parallel. Valid range is1–3on a standard Raspberry Pi. - PWM LSB Nanoseconds (
--led-pwm-lsb-nanoseconds) – the base time unit, in nanoseconds, used by the lowest significant bit of the PWM. Default130; good values for full colour are between100and300. Lower values give a higher refresh rate but may introduce ghosting (especially visible as bright text on a black background). If you see ghosting, increase this value. - Multiplexing (
--led-multiplexing) – the pixel-multiplexing mode of the panel.0 — Directis the default and works for standard panels;1 — Stripe,2 — Checkeredand higher numbers are needed by various “outdoor” or scan-multiplexed panels. If the image is correct but the pixels appear scrambled or split into stripes, try the next multiplexing value. - LED Sequence (
--led-rgb-sequence) – the colour order of the LEDs. Default isRGB. If the colours are swapped on your panel (e.g. red appears as blue), try one of the other permutations:RBG,GRB,GBR,BRG,BGR. - Refresh Rate Limit (Hz) (
--led-limit-refresh) – an upper bound on the panel's refresh rate.0means no limit. Setting an explicit value (e.g.100) reduces visible flicker when the system is loaded and gives a more stable look when the panel is filmed on camera. The trade-off is a slightly lower peak brightness. - GPIO Slowdown (
--led-slowdown-gpio) – slows the GPIO clock so the panel can keep up. Default1; values of2or higher are commonly needed on Raspberry Pi 3/4. If you see random flickering pixels, colour fringes or “static” on parts of the panel, increase this value one step at a time until the artefacts disappear. - Hardware Pulsing (inverse of
--led-no-hardware-pulse) – when enabled, the library uses the Raspberry Pi's hardware PWM subsystem for the panel timing. This produces a much more stable image than software pulsing. Leave it enabled unless you are debugging a conflict (e.g. with the on-board sound chip).
config.ini so you can roll back. Change one parameter at a time and observe the result on the dashboard preview before making further adjustments.
4.6 Network Settings
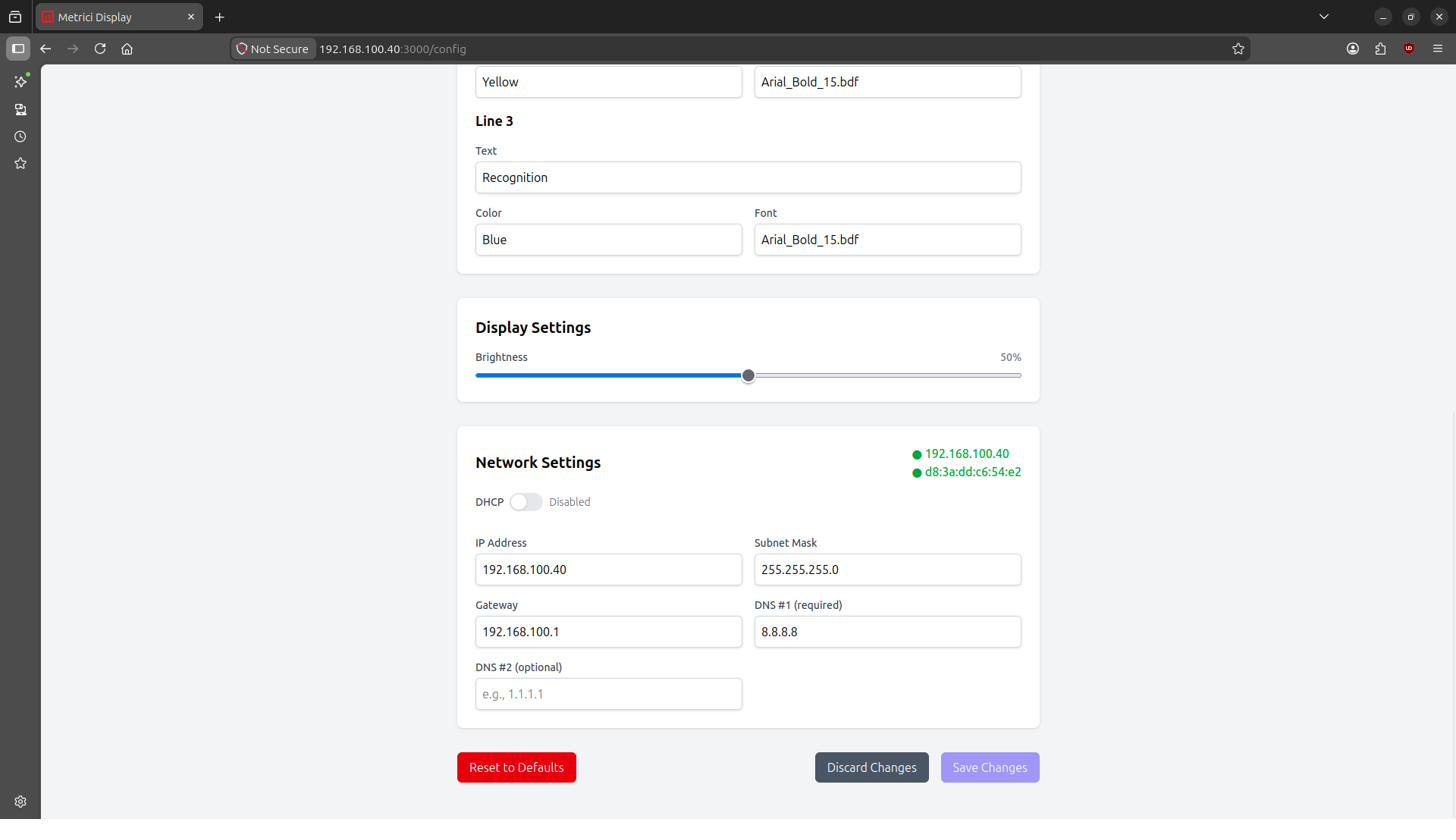
This section lets you configure how the device connects to your network. The currently active IP address and MAC address are shown in the upper-right corner of the panel as quick-reference indicators. — see Fig.6 Network Settings.
- DHCP – a toggle. When enabled, the device requests an IP address automatically. When disabled (Static mode), the following fields become editable:
- IP Address – the static IPv4 address assigned to the display (e.g.
192.168.100.40). - Subnet Mask – the subnet mask for the network (e.g.
255.255.255.0). - Gateway – the default gateway (e.g.
192.168.100.1). - DNS #1 (required) – the primary DNS server (e.g.
8.8.8.8). - DNS #2 (optional) – a secondary DNS server (e.g.
1.1.1.1).
When you change any network-related value and click Save Changes, a countdown dialog appears. After the countdown a new browser tab opens with the new address, so you can continue using the interface without manually locating the new IP.
4.7 Import / Export Configuration
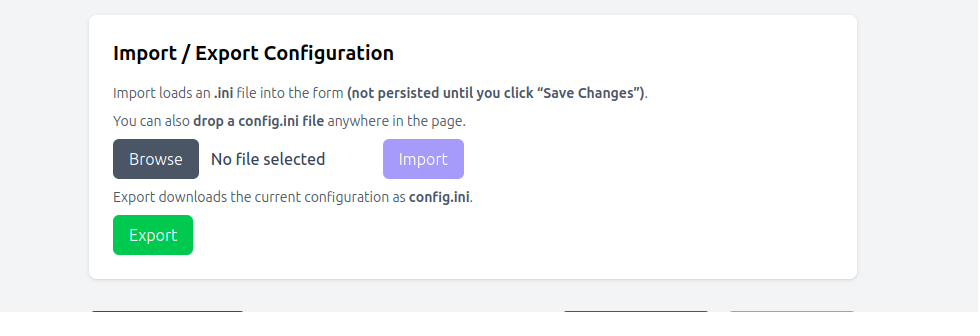
This panel lets you back up or replicate the entire display configuration as a single config.ini file. It is particularly useful when deploying several displays with identical settings.
- Import – click Browse to choose a
.inifile from your computer, then click Import. The values from the file are loaded into the form but are not persisted until you click Save Changes at the bottom of the page. You can also drag and drop aconfig.inifile anywhere on the page to load it. - Export – click the green Export button to download the current configuration as a
config.inifile.
4.8 Saving, Discarding, Resetting & Rebooting
At the bottom of the Configuration page there are three buttons:
- Save Changes – writes the new configuration to the device. The button is disabled until you have actually changed something.
- Discard Changes – restores the values that were originally loaded when you opened the page.
- Reset to Defaults – restores the factory configuration. A confirmation dialog asks you to confirm because the action cannot be undone.
5. Logs Page
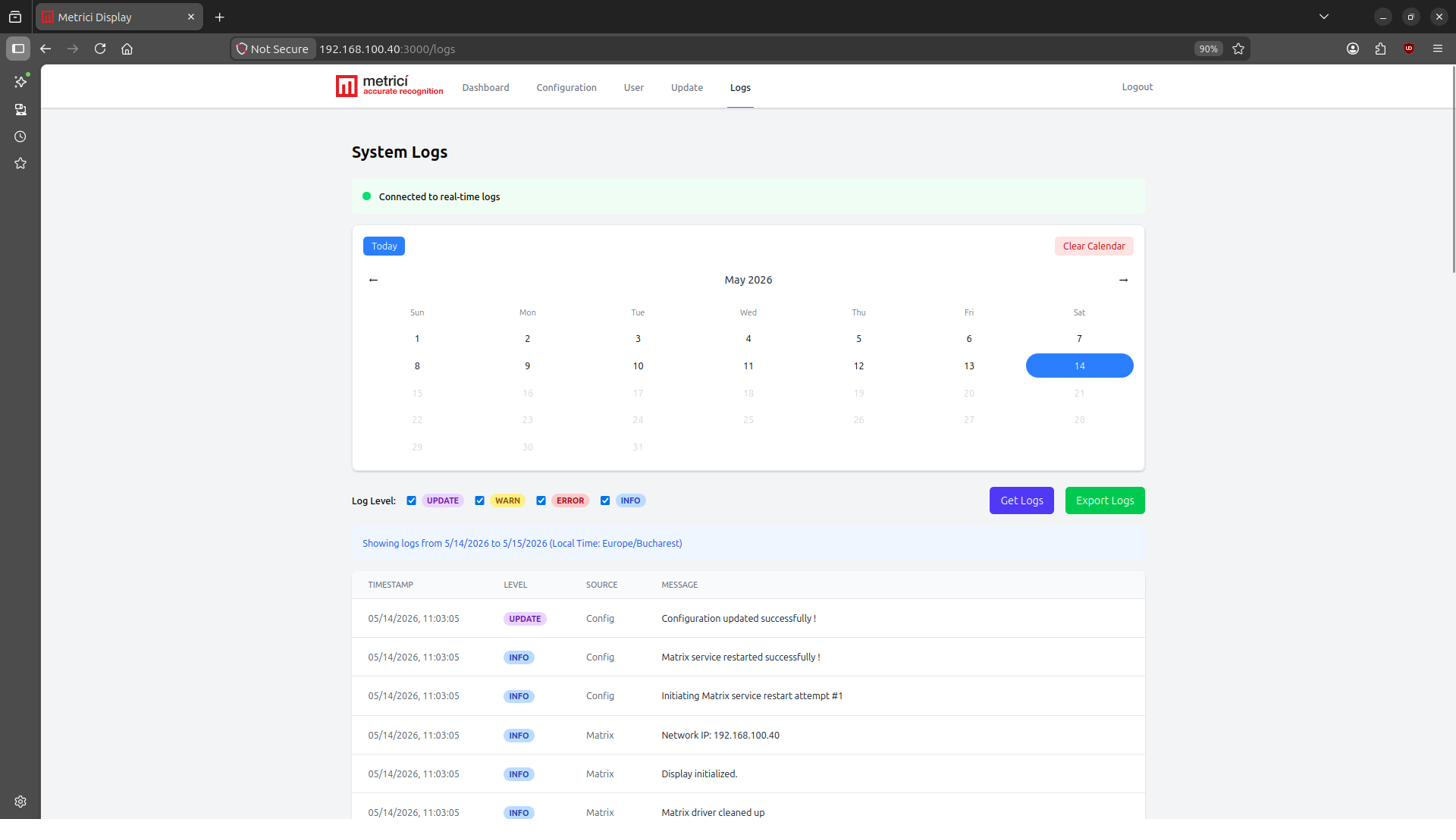
The Logs page displays a chronological list of system events. At the top, a green banner indicates whether the page is Connected to real-time logs.
- Calendar – select one or more days from the month view. The currently selected day is highlighted in blue; days with no logs are dimmed. Use the ← and → arrows to navigate between months, the Today button (top-left) to jump back to the current day, and Clear Calendar (top-right) to clear the selection.
- Log Level filters – four checkboxes (
UPDATE,WARN,ERROR,INFO) let you decide which severity levels are shown. - Get Logs – purple button that loads the entries matching the selected day(s) and filters.
- Export Logs – green button that downloads the filtered entries as a file.
- Above the log table, a status line shows the current range and the local time zone (for example, Showing logs from 5/14/2026 to 5/15/2026 (Local Time: Europe/Bucharest)).
- Each row contains a timestamp, a coloured severity badge, the source of the event (
Backend,Matrix,Config) and the message.
6. Update Page
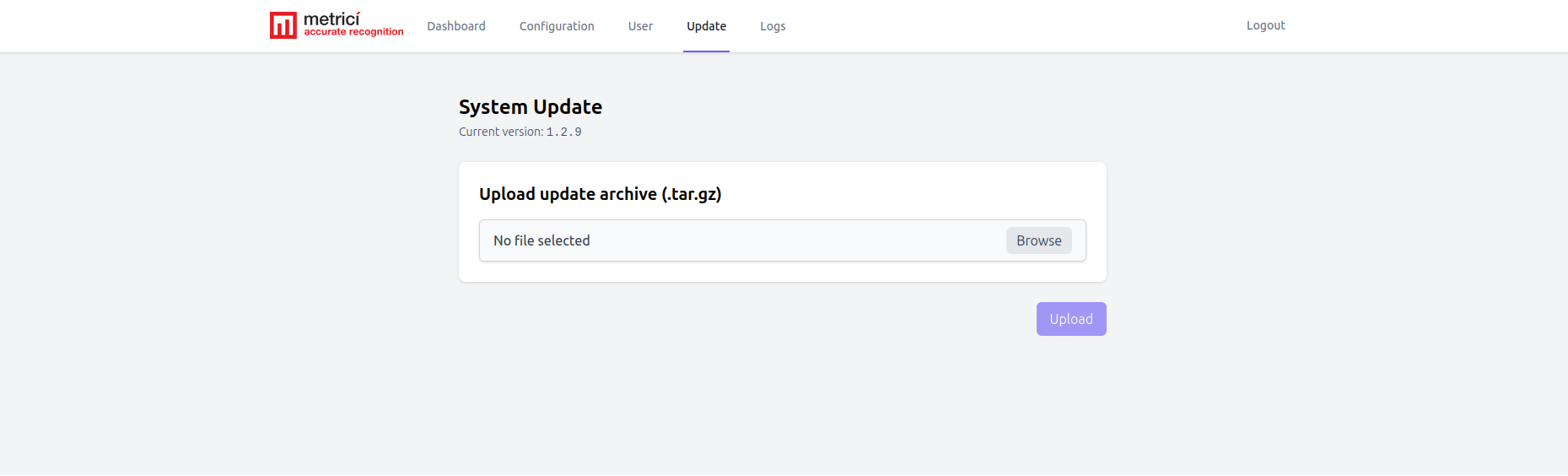
From the Update page you can install newer versions of the Metrici Display software — see Fig.9 System Update.
- The Current version is displayed at the top (for example,
1.2.9). - Updates are distributed as
.tar.gzarchives. You can download the latest archive from the Metrici support page and save it locally. - Click Browse to select the downloaded archive, then click Upload to start the update process.
- The device will automatically reboot when the update finishes. After the reboot you can return to the Dashboard to verify the new version.
7. User Page
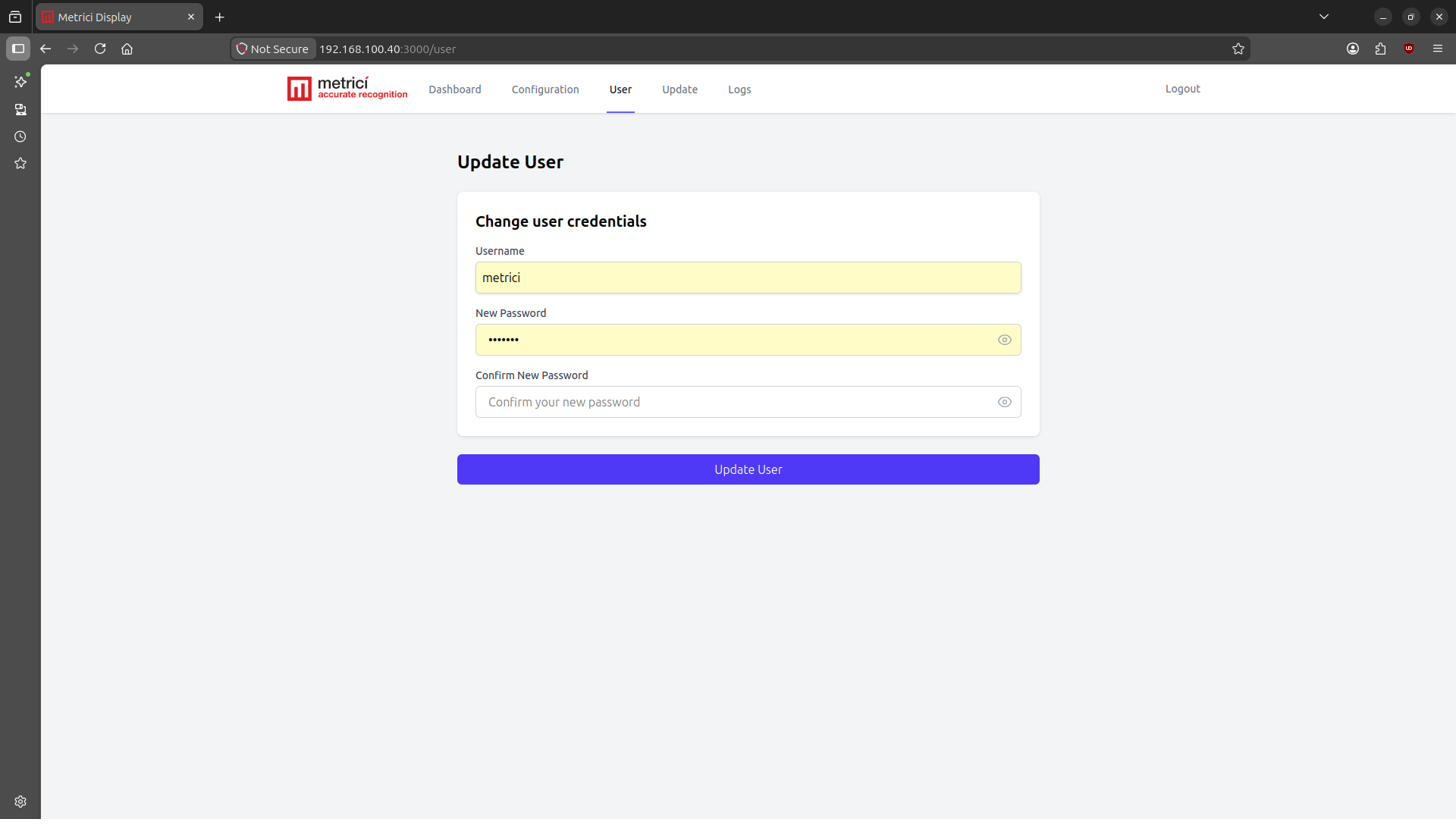
The User page lets you change the credentials of the currently logged-in account. The default credentials are metrici / metrici and we strongly recommend changing them after the first login. The form contains three fields — see Fig.10 Update User:
- Username – pre-filled with the current username; edit it to change it.
- New Password – type the new password. Use the eye icon on the right of the field to reveal or hide the characters.
- Confirm New Password – retype the new password to confirm.
Click the blue Update User button to apply the changes. To end the current session at any time, click Logout in the top-right corner of the page.
The password cannot be recovered or reset from the interface, and there is no “forgot password” option. If you lose it, the only way to regain access to the display is to send the unit back to Metrici for a factory reset. Write the new credentials down or store them in a password manager before logging out.
8. Web Application Integration
When the display is configured with Display Source set to API, the content shown on the LED matrix is generated by a module of the Metrici web application- Interface (Parking for LPR, Area Counter, Line Counter, Parking Place Detector or any other module). For each module you have to do two things:
- In the web application, fill in the Display Text field with the codes that describe what should appear on the LED matrix.
- Copy the auto-generated URL from the web application and paste it into the API URL field of the display (see Section 4.2 – API Settings).
The Display Text uses two kinds of codes: colour codes (which start with # followed by a letter) and data codes (which start with # followed by the name of the value). The colour code applies to everything that follows it until the next colour code.
8.1 Colour Codes
The following colour codes are supported across all modules:
#Y– Yellow#R– Red#G– Green#O– Orange#B– Blue#I– Indigo#V– Violet#W– White
A number from 1 to 9 may be appended to a data code to define how many characters are reserved for that value (for example, #COUNTER3 reserves three characters). If the rendered length exceeds the physical width of the panel, the line scrolls.
8.2 Parking Module for LPR
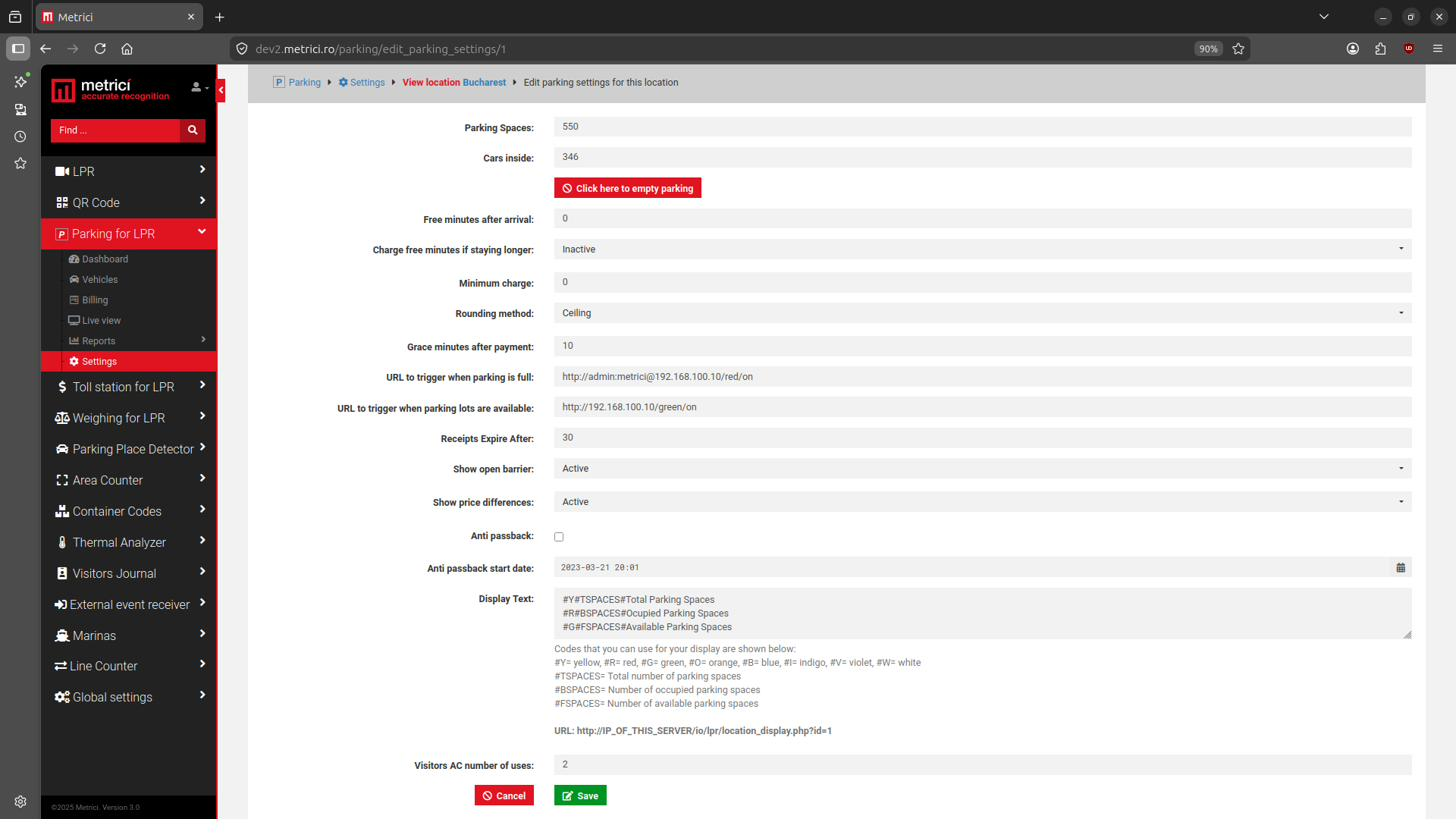
In the web application navigate to Parking for LPR → Settings, select the location and click Edit Parking Settings. We need to customize what we want to see in Display Text field — see Fig.11 Parking for LPR.
The data codes available for the Parking module are:
#TSPACES– total number of parking spaces.#BSPACES– number of occupied (busy) parking spaces.#FSPACES– number of available (free) parking spaces.
Example: #Y#TSPACES#Total Parking Spaces #R#BSPACES#Occupied Parking Spaces #G#FSPACES#Available Parking Spaces
The auto-generated URL has the form:
http://IP_OF_THIS_SERVER/io/lpr/location_display.php?id=1Copy this URL into the API URL field on the display. The Parking Settings page also exposes URL to trigger when parking is full and URL to trigger when parking lots are available, which can be pointed to the display's HTTP endpoints (e.g. http://admin:metrici@192.168.100.40/red/on) to change the colour of an external indicator.
For full details refer to the Parking Module for LPR – Settings chapter of the Metrici Web Interface manual.
8.3 Area Counter
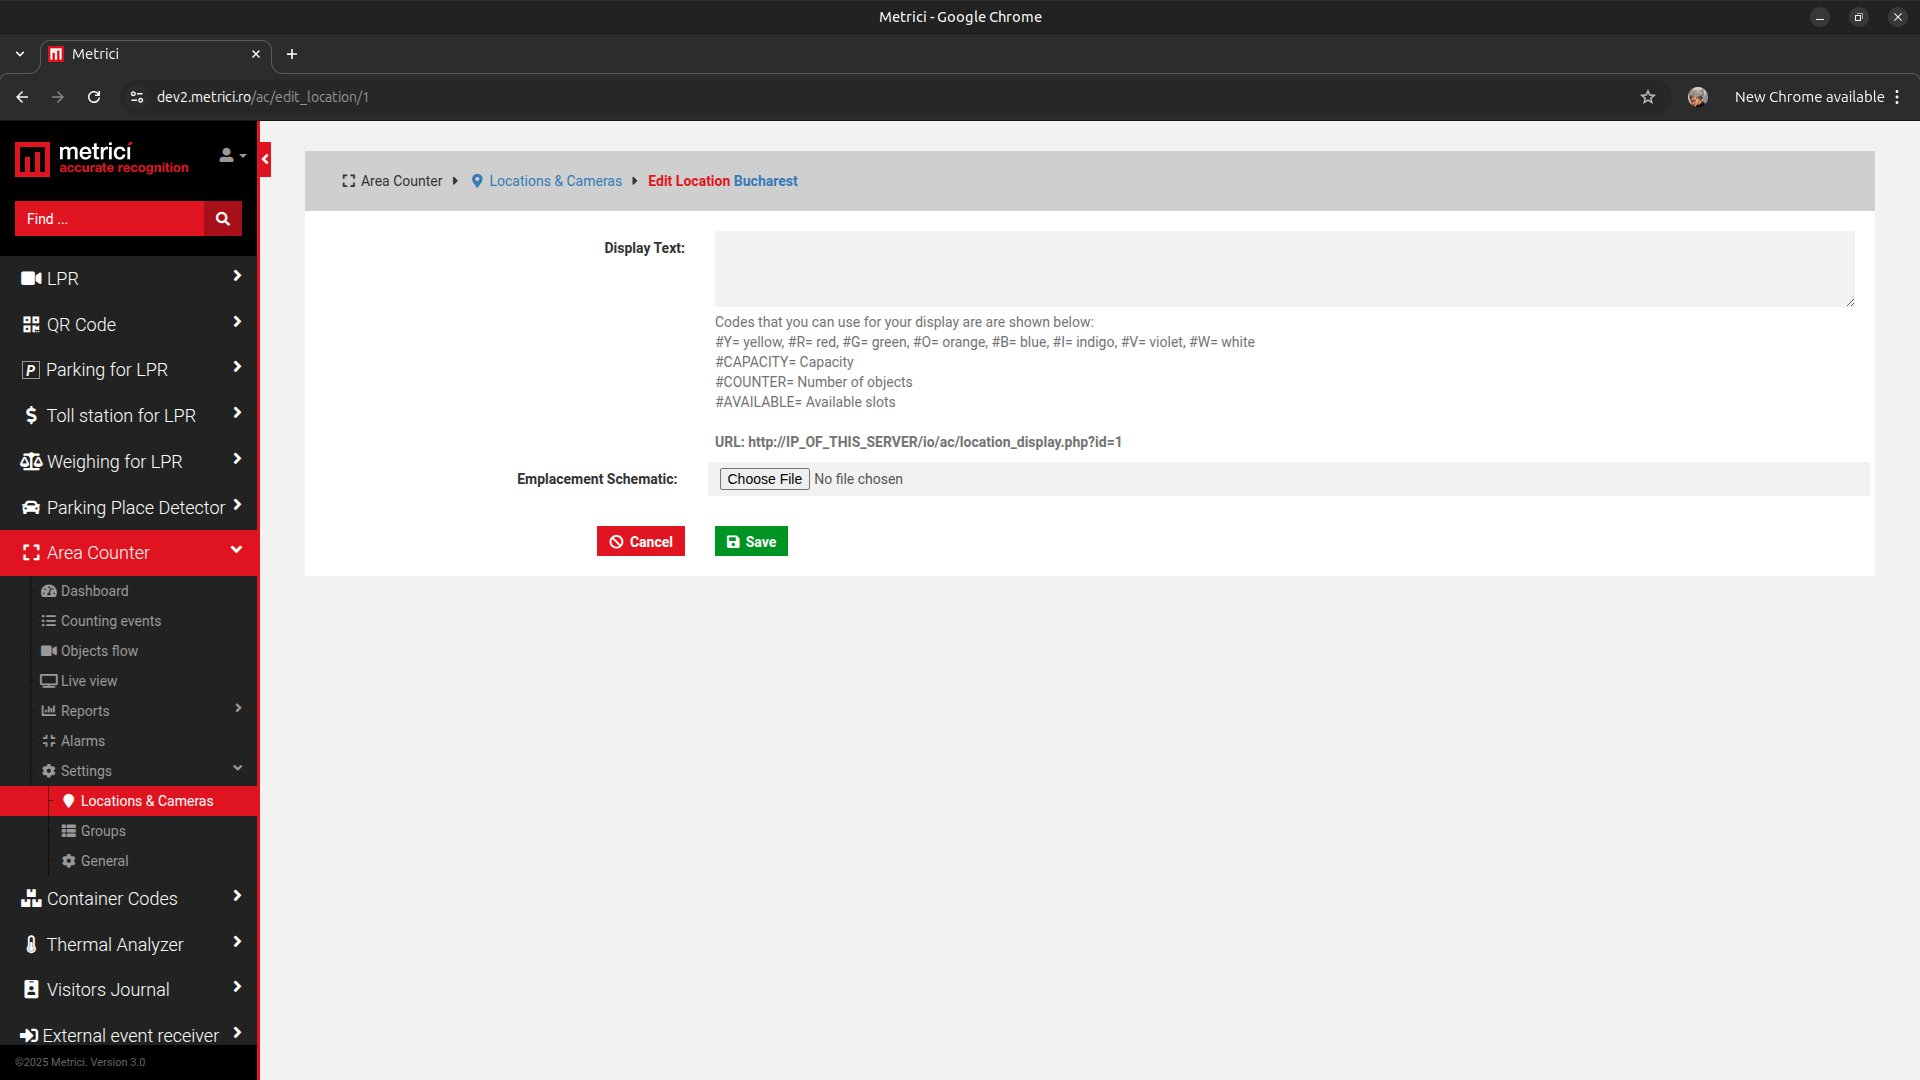
In the web application navigate to Area Counter → Settings → Locations & Cameras, select the location and click the blue Edit button. Fill in the Display Text field — see Fig.12 Area Counter.
The data codes available for the Area Counter module are:
#CAPACITY– total capacity of the zone.#COUNTER– current number of detected objects.#AVAILABLE– number of available slots.
Example: #YCapacity=#CAPACITY3 #RBusy=#COUNTER3 #GAvailable=#AVAILABLE3
The auto-generated URL has the form:
http://IP_OF_THIS_SERVER/io/ac/location_display.php?id=11The same Display Text mechanism can also be applied at the Group level (a group is a collection of zones sharing a characteristic). For full details refer to the Area Counter – Settings chapter of the Metrici Web Interface manual.
8.4 Line Counter
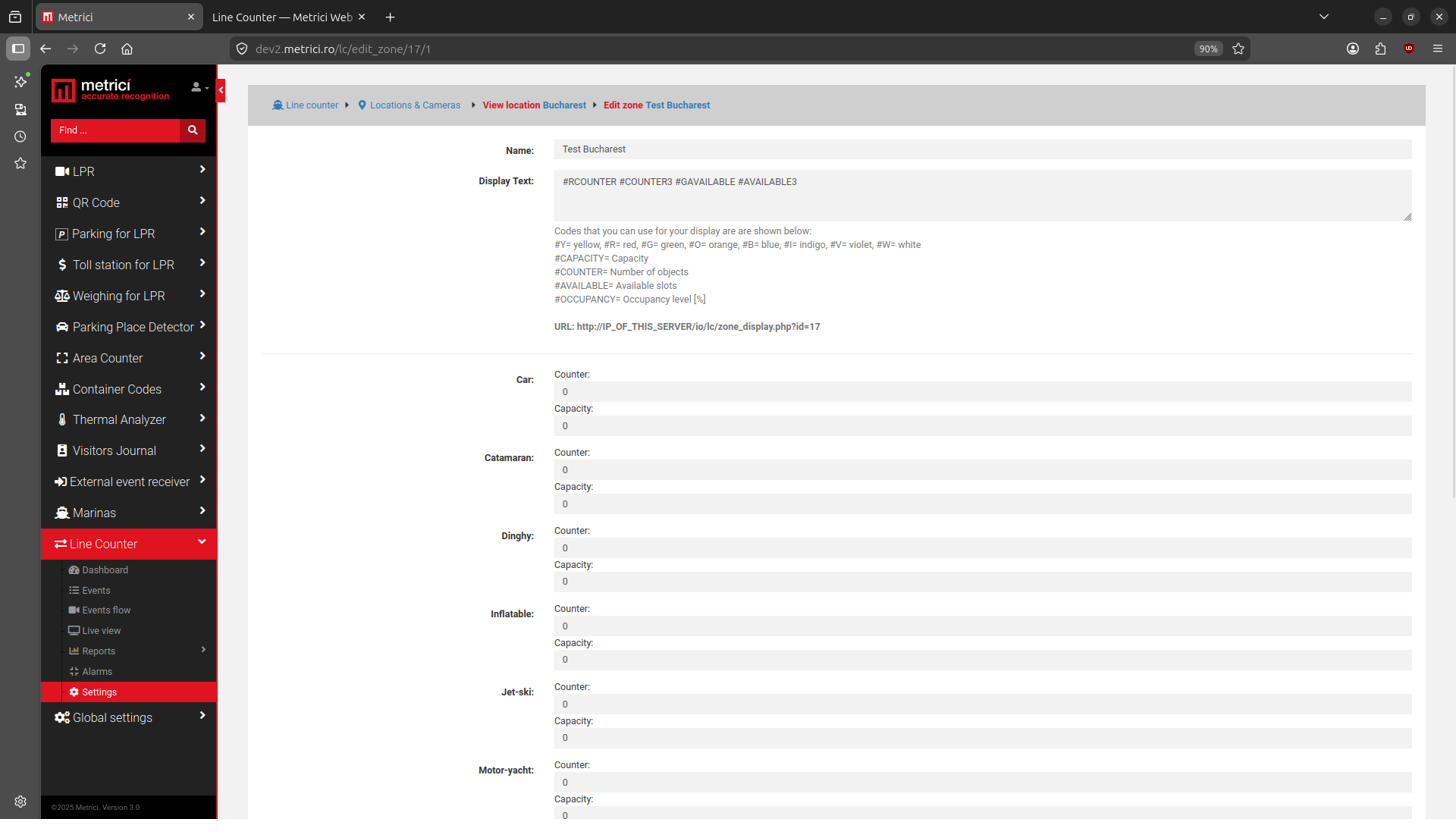
In the web application navigate to Line Counter → Settings, select the location and the zone you want to edit, then click Edit Zone. Fill in the Display Text field — see Fig.13 Line Counter.
The data codes available for the Line Counter module are:
#CAPACITY– total capacity of the zone.#COUNTER– current number of objects inside the zone.#AVAILABLE– number of available slots.#OCCUPANCY– occupancy level expressed as a percentage.
Example: #RCOUNTER #COUNTER3 #GAVAILABLE #AVAILABLE3
The auto-generated URL has the form:
http://IP_OF_THIS_SERVER/io/lc/zone_display.php?id=17For full details refer to the Line Counter – Settings chapter of the Metrici Web Interface manual.
8.5 Parking Place Detector
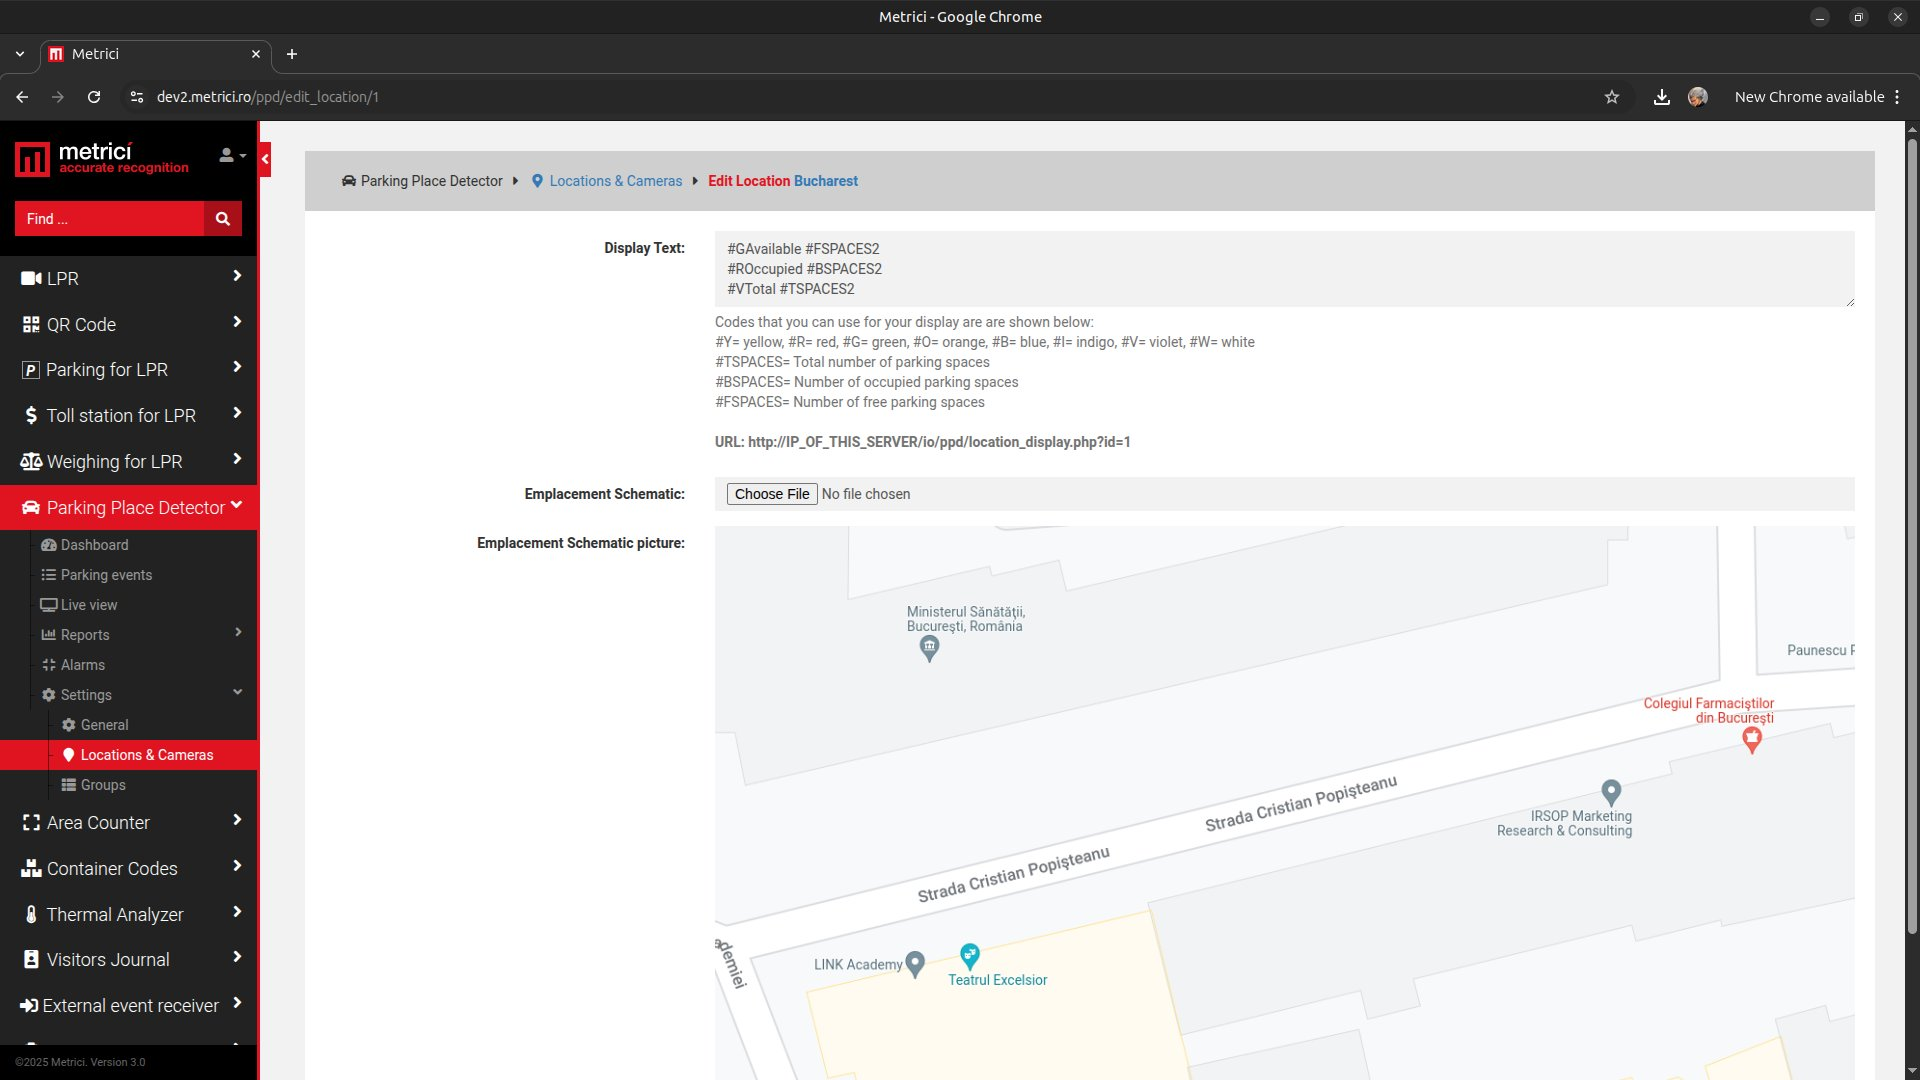
In the web application navigate to Parking Place Detector → Settings → Locations & Cameras, select the location and click the blue Edit button. Fill in the Display Text field.
The data codes available for the Parking Place Detector module are:
#TSPACES– total number of parking spaces.#BSPACES– number of occupied parking spaces.#FSPACES– number of free parking spaces.
Example (each line on its own row, as shown in the screenshot above):
#GAvailable #FSPACES2
#ROccupied #BSPACES2
#VTotal #TSPACES2
The auto-generated URL has the form:
http://IP_OF_THIS_SERVER/io/ppd/location_display.php?id=1The same Display Text mechanism can also be applied at the Group level. For full details refer to the Parking Place Detector – Settings chapter of the Metrici Web Interface manual.
8.6 Quick Checklist
- In the web application, fill in the Display Text field of the relevant module using colour codes and data codes.
- Copy the auto-generated URL from the same page.
- On the display, open Configuration, set Display Source to API, paste the URL into API URL, and set a sensible Poll Interval (typically
1second). - Click Save Changes. Verify on the Dashboard that the Currently on display preview shows the expected content and that the Dynamic Content field on the Configuration page reflects the API response.
9. General Tips & Troubleshooting
- All forms validate input automatically; error messages appear in red directly under the problematic field.
- When the system is performing a long-running operation (saving, rebooting, updating) the UI dims and a spinner appears. Simply wait for it to disappear.
- If the interface becomes unresponsive, press F5 (or click the browser's refresh button) to reload the page.
- If the LED matrix appears blank after switching to API mode, verify the Dynamic Content preview on the Configuration page — an empty value indicates that the API URL is unreachable or returning no data.
- If the LED matrix shows API ERROR, check that a colour code (e.g.
#R,#G) appears before each piece of text — without one, the error is rendered. - After changing the network configuration, the device may be reachable on a new IP. Use the countdown redirect dialog, or check the physical display for the new address.
- Before performing a firmware update, export the current configuration via Import / Export Configuration so you can quickly restore it if needed.